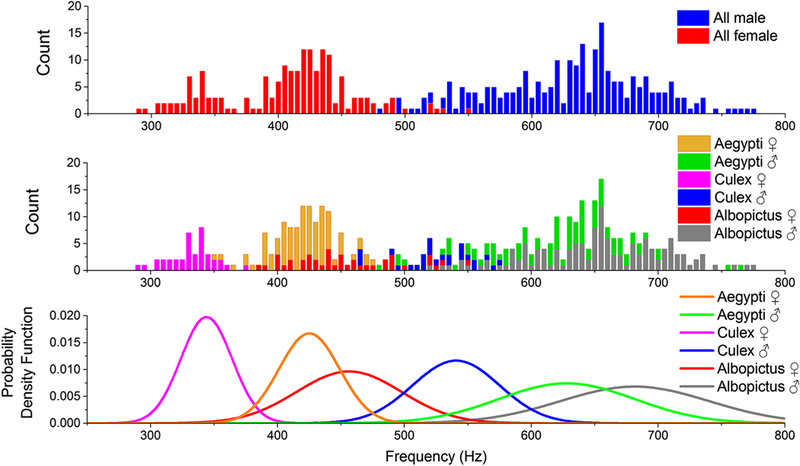
Fig. 4.

Histogram of the measured wing beat frequencies for all females and males (top), all species and both genders (middle) and their respective probability density function (bottom). Every bar has a width of 5 Hz and its value is the number of events measured within this frequency window
