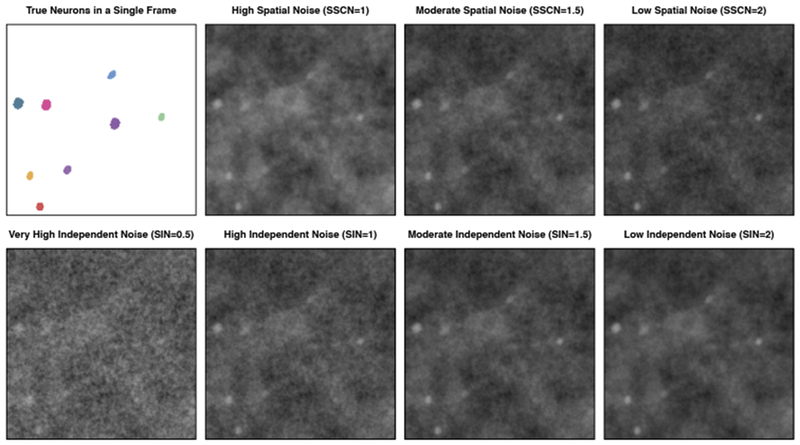
Fig. 11.

We illustrate the various noise scenarios that we consider for the simulated calcium imaging data described in Section 7.1. We vary the signal to spatially correlated noise (SSCN) ratio and the signal to independent noise (SIN) ratio. We show the simulated neurons truly active during a particular frame, along with the simulated data for that frame for each of the noise scenarios. The top row of frames has a variable strength of spatially correlated noise with a fixed strength of independent noise (SIN = 1.5), and the bottom row of frames has a variable strength of independent noise with a fixed strength of spatially correlated noise (SSCN = 1.5).
