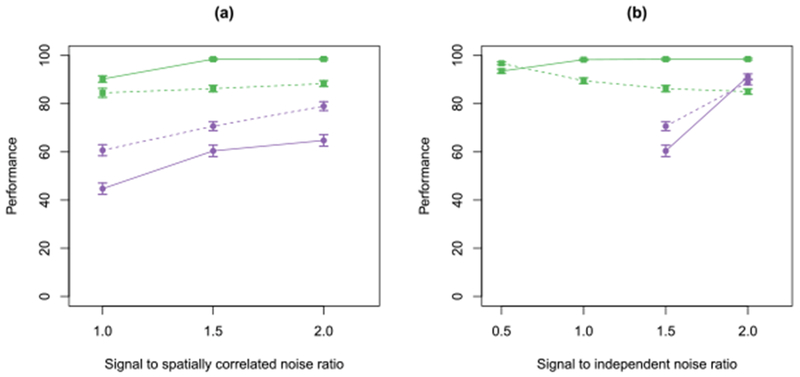
Fig. 12.

We illustrate the performance of SCALPEL ( ) and CNMF-E [Zhou et al. (2016)] (
 ) in terms of the average sensitivity (percent of true neurons detected; shown as a solid line) and precision (percent of neurons detected that are true neurons; shown as a dashed line) for the simulated calcium imaging data described in
Section 7.1. For both, 95% confidence intervals are shown. In (a), we consider the performance for a fixed signal to independent noise ratio of 1.5 and varying signal to spatially correlated noise ratio. In (b), we consider the performance for a fixed signal to spatially correlated noise ratio of 1.5 and varying signal to independent noise ratio. Note that CNMF-E was unable to initialize neurons in the presence of a high amount of independent noise, so the CNMF-E results are omitted for ratios of 0.5 and 1 in (b).
