Fig. 2.

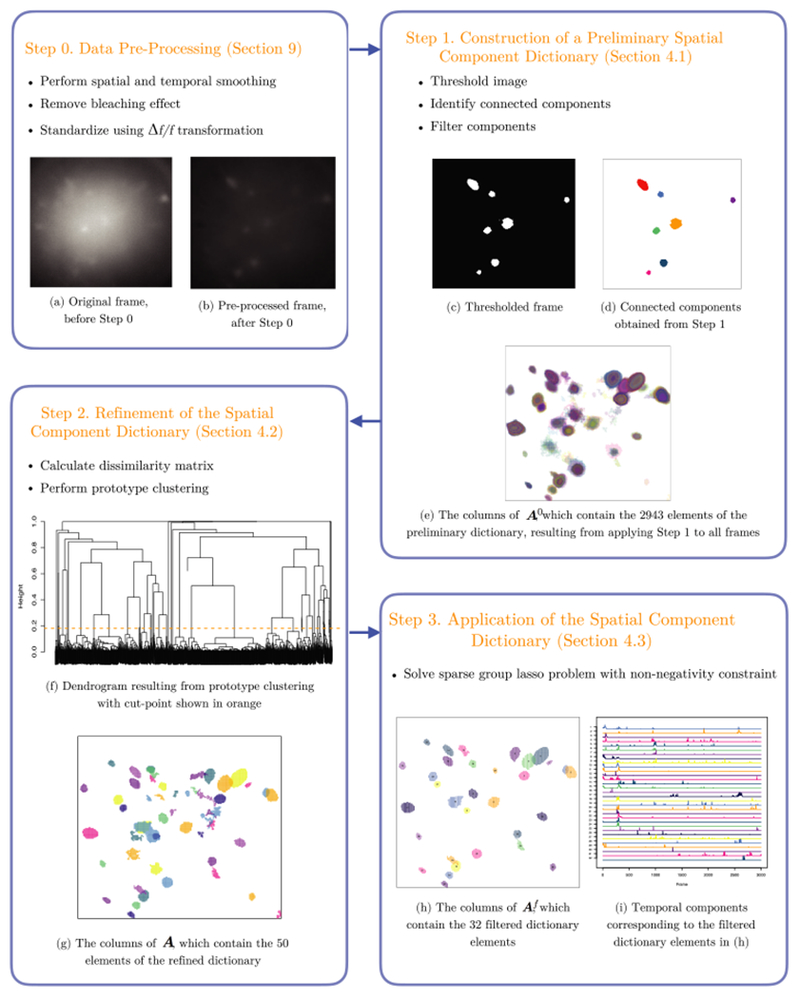
A summary of the SCALPEL procedure, along with the results of applying each step to an example data set with 205 × 226 pixels and 3000 frames, described in the text in Section 4, and analyzed in greater detail in Section 6.2.

A summary of the SCALPEL procedure, along with the results of applying each step to an example data set with 205 × 226 pixels and 3000 frames, described in the text in Section 4, and analyzed in greater detail in Section 6.2.