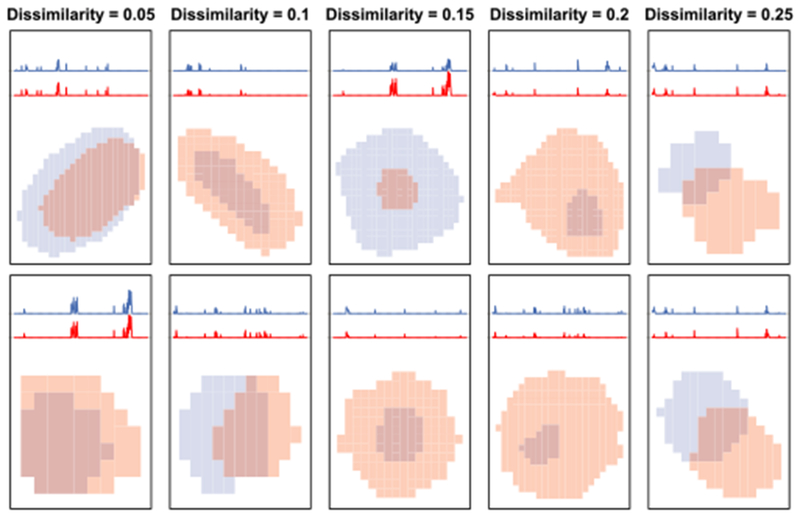
Fig. 4.

Each column displays two pairs of preliminary dictionary elements with overall dissimilarities, as defined in (5), of 0.05, 0.1, 0.15, 0.2 and 0.25. For each preliminary dictionary element, the average thresholded fluorescence over time and the (zoomed-in) spatial map are shown. These results are based on the example calcium imaging video.
