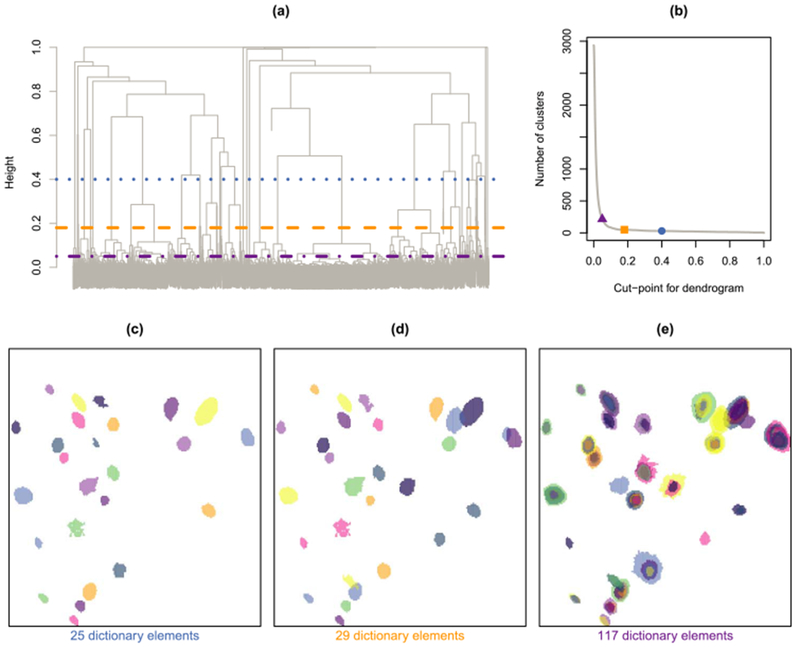
Fig. 5.

In (a), we display the dendrogram that results from applying prototype clustering to the example calcium imaging data set. Three different cutpoints are indicated: 0.05 ( ), 0.18 (
 ) and 0.4 (
 ). In (b), we display the number of clusters that result from these three cutpoints. In (c)–(e), we show the refined dictionary elements that result from using these three cutpoints. For simplicity, we only display dictionary elements corresponding to clusters with at least five members.
