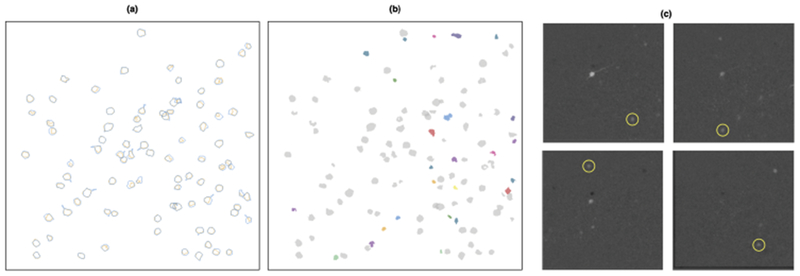
Fig. 9.

We present the results for the calcium imaging video analyzed in Section 6.3.1. In (a), we plot the outlines of the neurons identified by the Allen Institute in blue, along with the outlines of the corresponding SCALPEL neurons in orange. In (b), we plot the 25 potential neurons uniquely identified by SCALPEL in color, along with the SCALPEL neurons also identified by the Allen Institute in gray. In (c), we provide evidence for four of the 25 unique neurons. Similar plots for all of the potential neurons uniquely identified by SCALPEL are available at www.ajpete.com/software.
