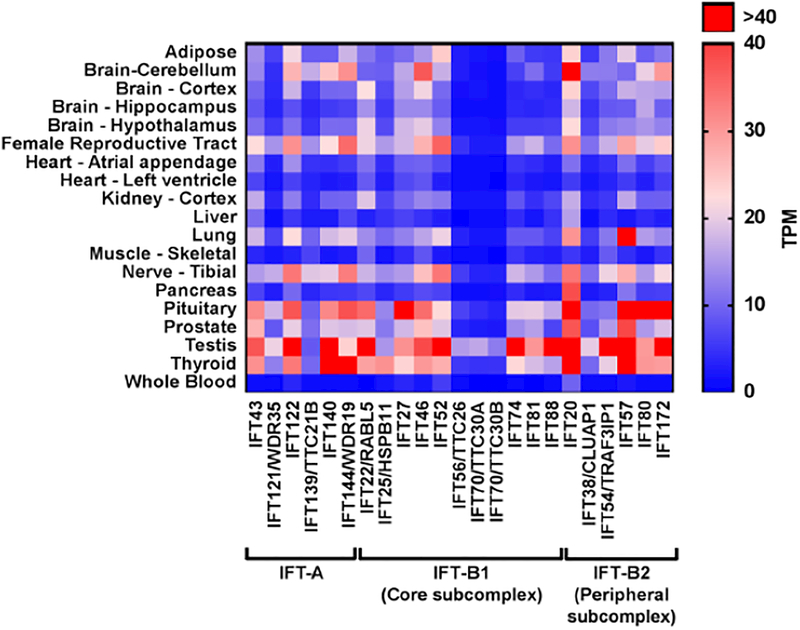
FIGURE 2: IFT-A and IFT-B gene expression in different adult tissues.
The heat map shows tissue-specific gene expression for IFT-A and IFT-B components (subcomplex IFT-B1 and IFT-B2) across differentiated human adult tissues. Raw transcript per million (TPM) values, representing gene expression values, were obtained from the GTEx database (https://www.gtexportal.org/home/). Red indicates higher expression (high TPM value) and blue indicates low expression (low TPM value), as reflected in the color gradient legend (right).

