
Figure 5.
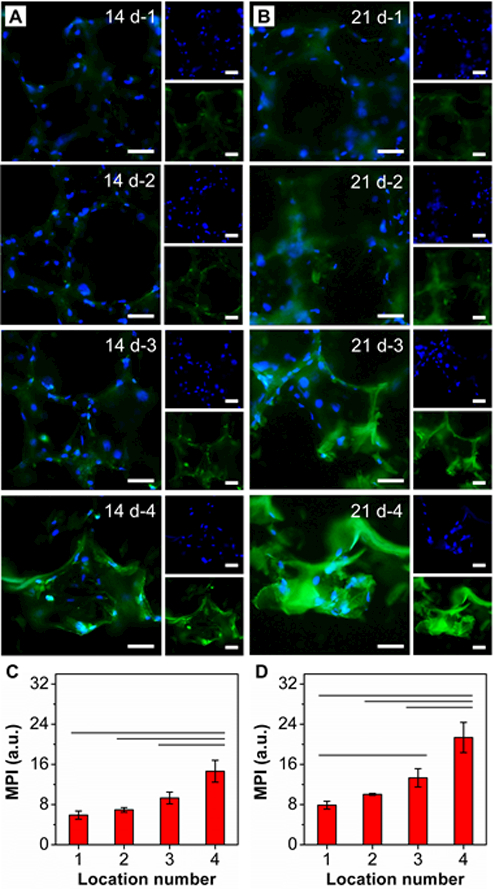
OCN staining of ASCs seeded in the HAp-graded PLGA inverse opal scaffold after (A) 14 and (B) 21 days of culture at locations 1, 2, 3, and 4. Nuclei were stained with DAPI and shown in blue and OCN is shown in green. Scale bars: 50 μm. C, D) MPI analysis of OCN corresponding to images such as those shown in (A) and (B) (n = 3). Significant differences are indicated by lines over the bars (p < 0.05).