Figure 6.

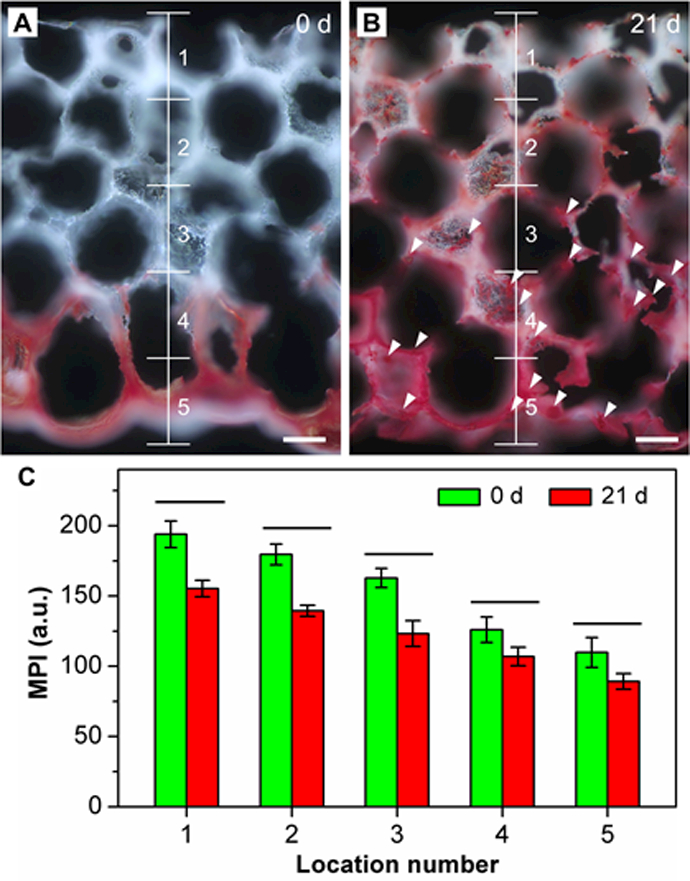
Dark-field images of Alizarin Red S staining of calcium deposition on the ASC-seeded HAp-graded scaffold after A) 0 and B) 21 days of culture. White arrowheads indicate the calcium nodules. Scale bars: 100 μm. C) MPI analysis of the images such as those shown in (A) and (B) (n = 3). Significant differences are indicated by lines over the bars (p < 0.05).
