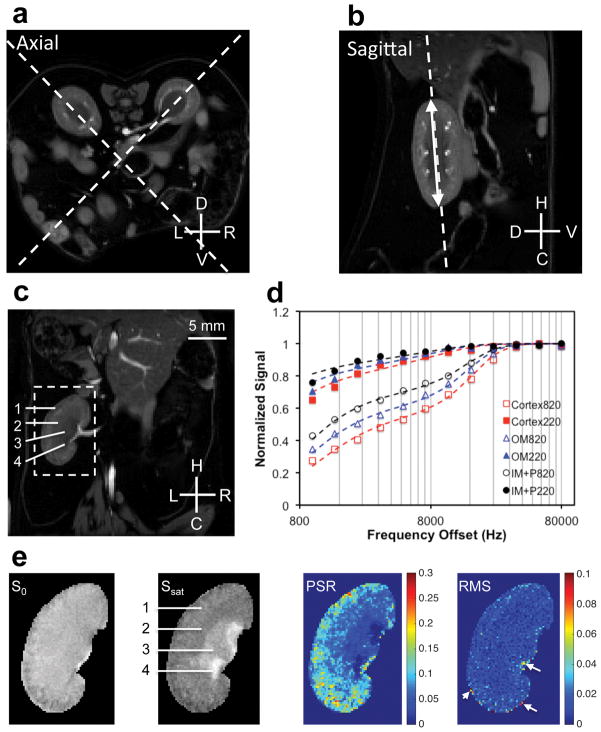
Figure 1. MRI data acquisition of mouse kidney for histological comparison.
(a–b) Examples showing the selection of coronal plane for qMT data acquisition. The coronal orientation allows the comparison between MRI and histological results. Dashed lines indicate the selected orientations on axial or sagittal images for qMT data acquisition. The double-headed arrow indicates the longitudinal length of kidney. L: left; R: right; D: dorsal; V: ventral; H: head; C: caudal. The axial and sagittal images are the water images from 3-point Dixon construction, and these images highlight kidneys in diabetic mice. (c) The selected water coronal image from 3-point Dixon reconstruction. 1-cortex, 2-outer medulla (OM), 3-inner medulla and papilla (IM+P), 4-extra renal space. (d) The example fitting of the model to regional MT data in kidney at two flip angles of θsat 220° and θsat 820°. (e) Segmented images zoomed on the left kidney without MT saturation (S0) and with MT saturation (Ssat) at θsat 820° and 5000 Hz RF offset, pool size ratio (PSR) map, and root mean squares of the residuals (RMS) from model fitting. Example shows DN (db/db eNOS−/−) mouse kidneys. The arrows indicate pixels with RMS larger than 0.05.

