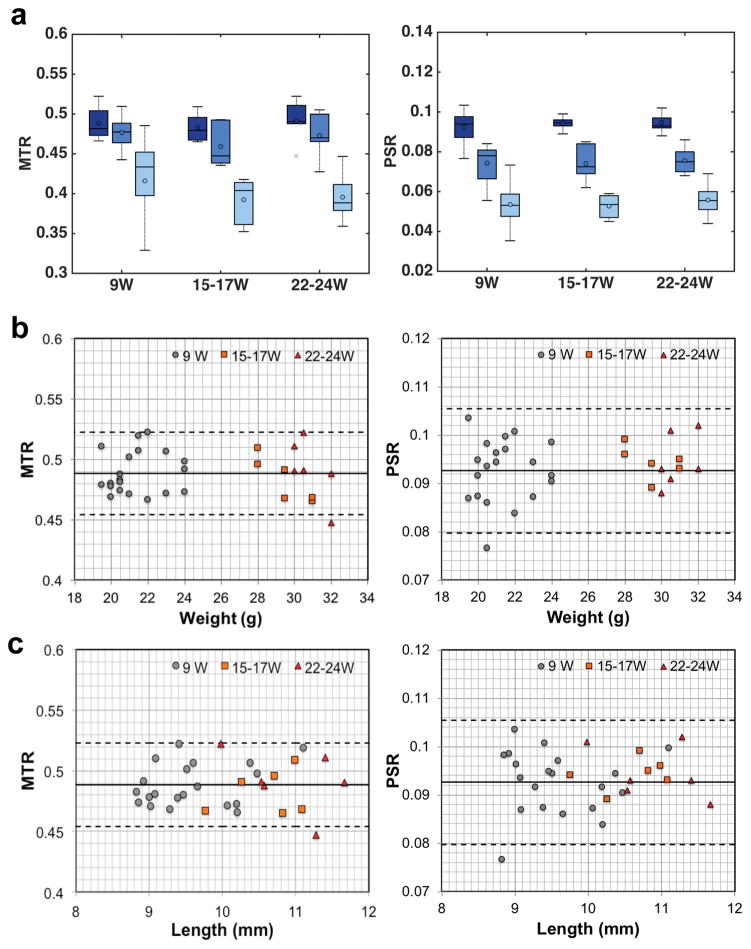
Figure 3. Changes of regional MTR and PSR with age, weight, and kidney size of normal mouse.
(a) Comparison of boxcar plots of averaged regional MTR and PSR in WT mouse kidneys. 9W: 9-week old WT mice (N=20); 15–17W: 15–17 week-old WT mice (N=6); 22–24W: 22–24 week-old WT mice (N=6). Cortex in the darkest color, OM in darker color, and IM+P regions in light color. The central lines and circles of the boxplots represent the medians and means respectively, and the box limits present the 25th and 75th percentiles. Crosses indicate outliers. (b–c) Changes of cortical MTR and PSR versus weight of mouse and kidney size (in length). Solid lines represent the mean cortical values, whereas the dashed lines are 95% limits of the agreement (mean±1.96SD) for 9-week WT kidneys.

