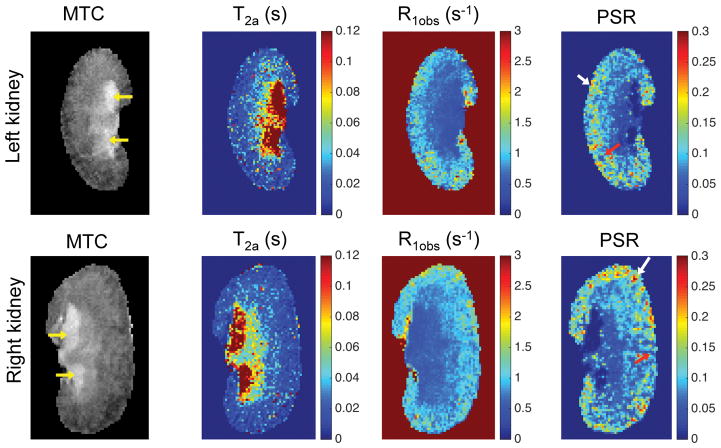
Figure 4. In vivo MRI parametric maps of DN mouse kidney.
The yellow arrows in MTC images indicate the enlarged extra-renal spaces due to urine retention. In PSR maps, red arrows indicate low PSR areas, while white arrows indicate high PSR regions. The data from a 24-week old DN (db/db eNOS−/−) mouse are shown.

