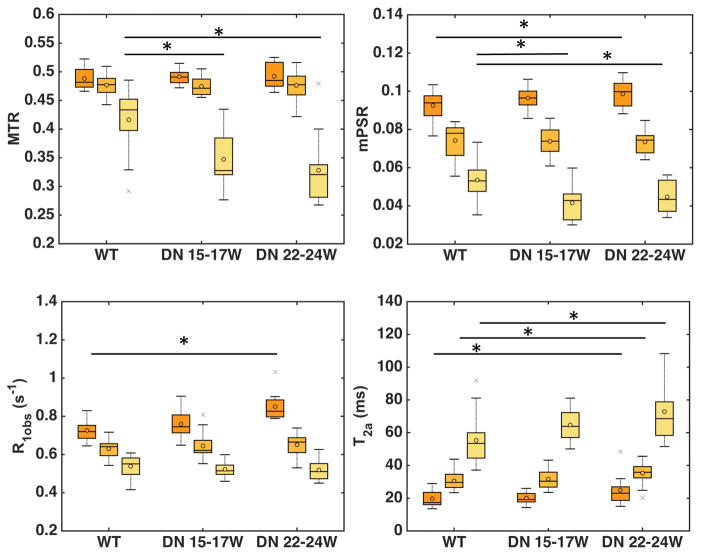
Figure 5. Comparison of the averaged renal regional measures across mouse models.
Boxcar plots of MRI parameters MTR, PSR, R1obs and T2a in WT and DN mice kidneys. Cortex (dark orange), OM (light orange), and IM+P regions (yellow) are shown. The central lines and circles of the boxplots represent the medians and means respectively, and the box limits present the 25th and 75th percentiles. Crosses indicate outliers. In the same model, all the parameters show significant differences between regions. Across WT and DN models, significant regional parametric differences are indicated by asterisks (*p < 0.05). WT: 9 week-old mice (20 kidneys); DN 15–17W:15–17 week-old db/db eNOS−/− mice (12 kidneys); DN 22–24W: 22–24 week-old db/db eNOS−/− mice (12 kidneys).

