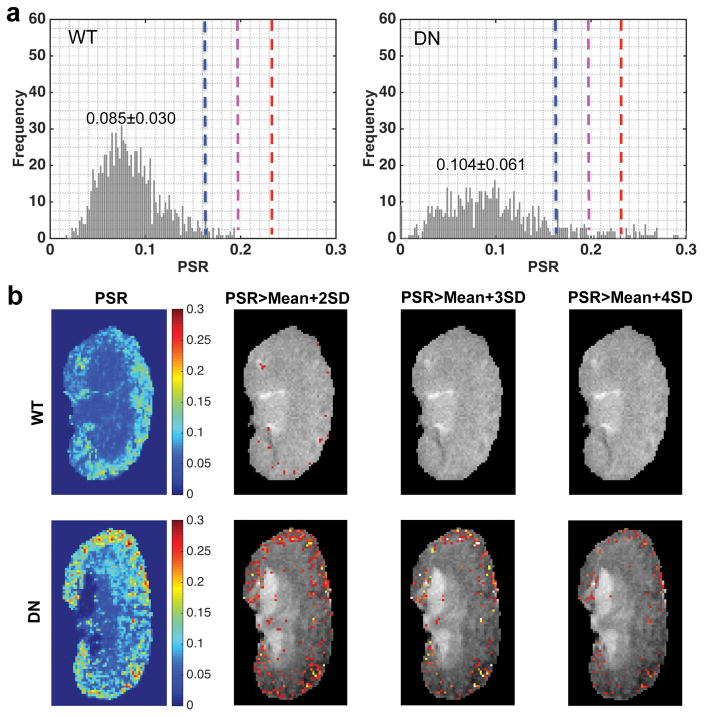
Figure 6. Comparison of PSR distributions and tPSR maps in the cortex of WT and DN kidneys.
(a) PSR distributions in the cortexes of representative WT and DN kidneys. The cortical mean and standard deviation (SD) values across pixels in the representative WT and DN kidneys are shown. The Mean and SD of cortical PSR across kidneys are obtained from 20 normal WT kidneys. The blue, purple and red dash lines indicate Mean+2SD, Mean+3SD, and Mean+4SD of PSR in cortex respectively. (b) PSR maps and threshold PSR maps that highlight the regions with significantly higher PSR values than those of normal mouse kidneys. The percent area with PSR>Mean+2SD, PSR>Mean+3SD or PSR>Mean+4SD in the total area of cortex is calculated for further comparison with histological fibrosis indexes.

