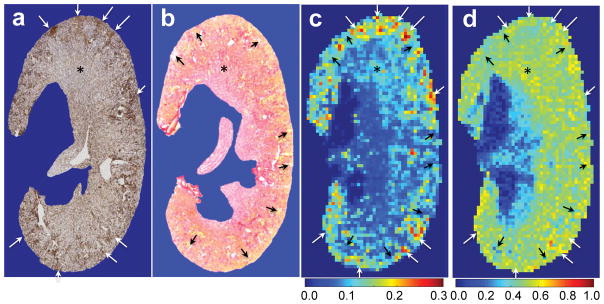
Figure 7. Example showing the global comparison of in vivo MT maps and histological sections of collagen IV and picrosirius red stains.
(a) One representative section (3 μm thickness) with collagen IV stain, from the same portion of in vivo qMT imaging. (b) One representative section showing the picrosirius red stain. (c) PSR with 0.133×0.133 mm2 in-plane resolution and 1 mm thickness. (d) MTR with 0.133×0.133 mm2 in-plane resolution and 1 mm thickness. Black arrows indicate low PSR regions that are associated with tubular enlargement and urine retention (indicated in yellow color in picrosirius red stain). White arrows indicate high PSR regions that are associated with accumulated collagen IV stains, indicating fibrosis. Note: The different thickness of MRI image and histological section, the partial volume in PSR measures, and the deformity during tissue section processing limit comparison of MRI data and histological results. The DN kidney at the age of 24 weeks is shown.

