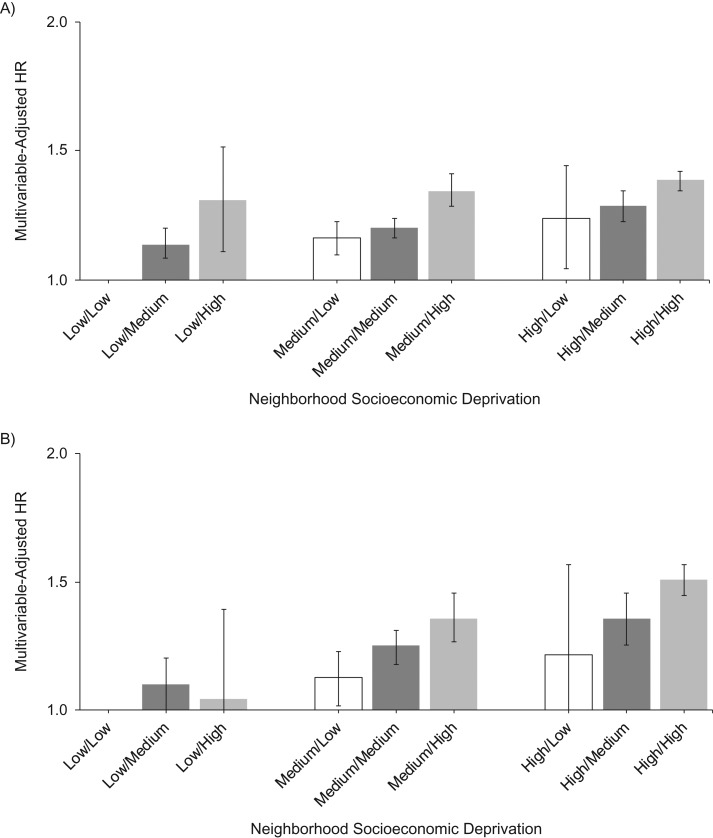
Figure 2.
Hazard ratios (HRs) for the association between neighborhood socioeconomic deprivation in 1990 and 2000 and total mortality in men (A) and women (B), National Institutes of Health-AARP Diet and Health Study, 1995–2011. The x-axis labels present the neighborhood deprivation groups for 1990/2000; for example, “low/high” indicates low neighborhood deprivation in 1990 and high deprivation in 2000. Results were adjusted for age (50.0–54.9, 55.0–59.9, 60.0–64.9, or ≥65.0 years), race/ethnicity (non-Hispanic white, non-Hispanic black, or other), and education (<12 years, high school graduation, some college, or college graduation/postgraduate study). State of residence (California, Florida, Georgia, Louisiana, Michigan, North Carolina, New Jersey, or Pennsylvania) was included as a random effect. Vertical lines represent 95% confidence intervals. The “low/low” group served as the reference group.

