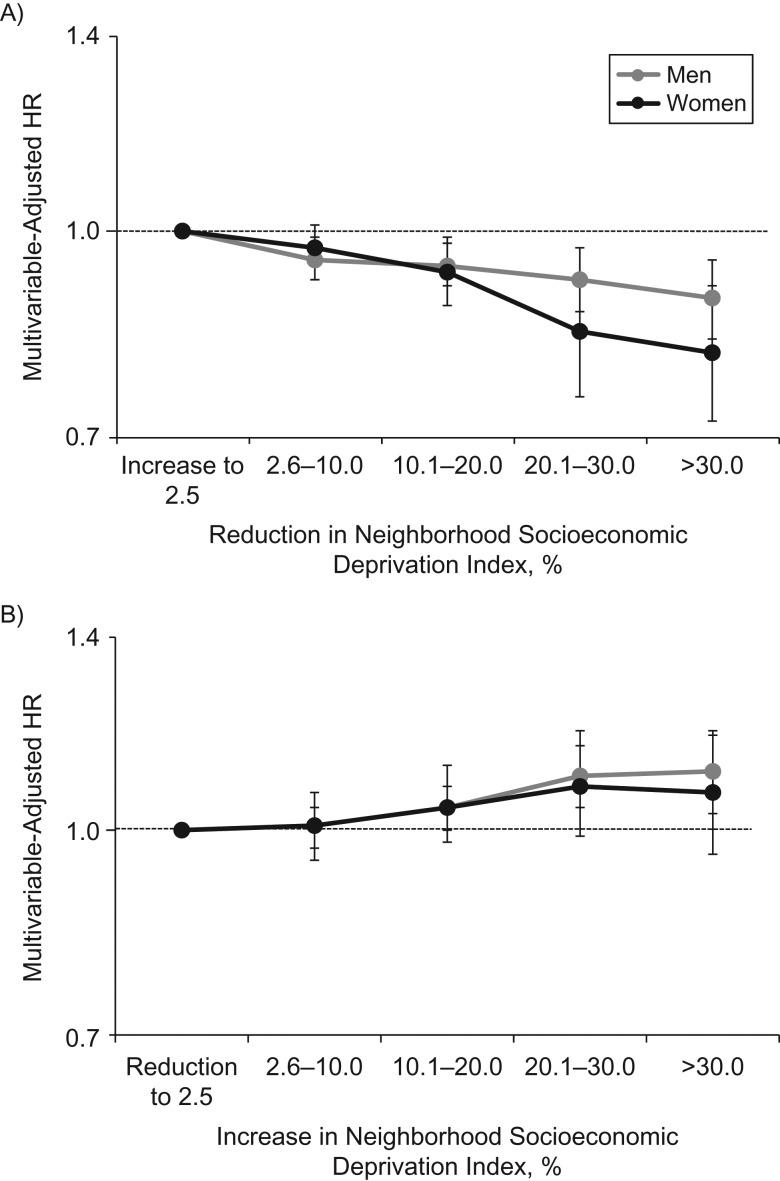
Figure 3.
Sex-specific hazard ratios (HRs) for the association between change in neighborhood socioeconomic deprivation between 1990 and 2000 and total mortality, National Institutes of Health-AARP Diet and Health Study, 1995–2011. Part A shows the association between a reduction in neighborhood deprivation and mortality among participants from a more deprived neighborhood in 1990 (neighborhood socioeconomic deprivation index > median), and the reference group included neighborhoods that had increases in deprivation, no change in deprivation, or a slight reduction in deprivation (up to 2.5%). Part B shows the association between an increase in neighborhood deprivation and mortality among participants from a less deprived neighborhood in 1990 (neighborhood socioeconomic deprivation index ≤ median), and the reference group included neighborhoods that had reductions in deprivation, no change in deprivation, or a slight increase in deprivation (up to 2.5%). Results were adjusted for age (50.0–54.9, 55.0–59.9, 60.0–64.9, or ≥65.0 years), race/ethnicity (non-Hispanic white, non-Hispanic black, or other), and education (<12 years, high school graduation, some college, or college graduation/postgraduate study). State of residence (California, Florida, Georgia, Louisiana, Michigan, North Carolina, New Jersey, or Pennsylvania) was included as a random effect. Vertical lines represent 95% confidence intervals.

