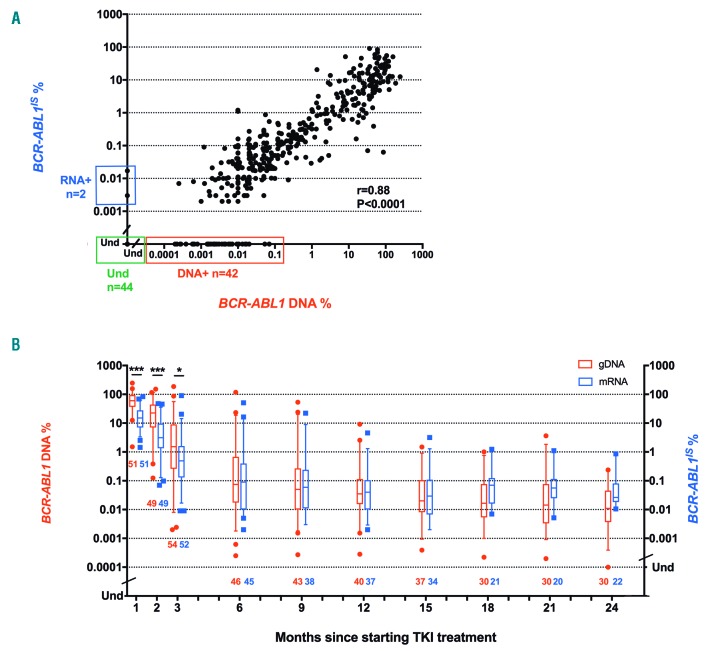
Figure 2.
Comparison between mRNA and DNA quantification of BCR-ABL1. (A) Positive values from DNA (red) and mRNA (blue) were compared during treatment until 24 months. The quantifiable mRNA and DNA values were highly correlated, but at very low levels 42 samples were positive by DNA PCR only (red square). (B) The mRNA and DNA values (number, median and interquartile range) are shown for individual time points up to 24 months. Note that the apparent increase in RQ-PCR after 18 months is due to the exclusion of RQ-PCR samples in which there was undetectable BCR-ABL1. *P<0.05; ***P<0.0001; Und.: undetectable.

