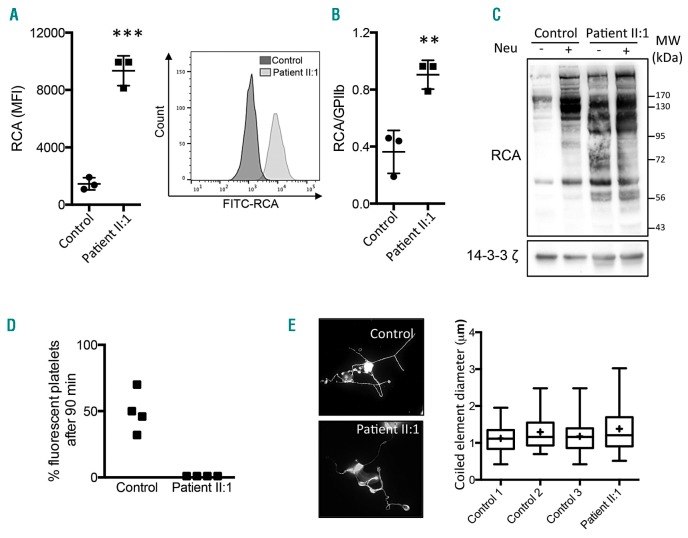
Figure 3.
Effect of SLC35A1 mutation on platelet sialylation, life span and proplatelet formation. A) Left panel: the mean fluorescence intensity (MFI) of Ricinus communis agglutinin I (RCA) for three healthy controls and patient II:1 in triplicate. Right panel: the histogram for FITC-RCA labeling on platelets from controls and II:1. Platelet surface β-galactose exposure was determined using flow cytometry with FITC-conjugated RCA (12.5 μg/mL, Vector Labs). Platelet-rich plasma (5 μL) was incubated with 12.5 μg/mL RCA for 30 min at room temperature in a final volume of 100 μL. The reaction was terminated by adding PBS (400 μL), and the samples were immediately analyzed in a flow cytometer (Beckman Coulter). For each sample, the MFI was determined for a total of 20,000 cells. GPIIb glycoprotein was also quantified by using the PLT GP/Receptors® assay (Biocytex). B) The mean ± SEM RCA/GPIIb ratio for three healthy controls and the patient II:1 in triplicate (**P<0.01, ***P<0.001 in Student’s t-test). C) A lectin blot of washed platelets. Washed platelets (3×10⁸/mL) were completely desialylated (or not) by treatment with α2-3,6,8 neuraminidase from Clostridium perfringens (0.2 U/mL, 15 min, Sigma-Aldrich, indicated as Neu). After 15 min, washed platelets from the control and from II:1 were lysed in SDS denaturing buffer (50 mM Tris, 100 mM NaCl, 50 mM NaF, 5 mM EDTA, 40 mM β-glycerophosphate, 100 μM phenylarsine oxide, 1% SDS, 5 μg/mL leupeptin, 10 μg/mL aprotinin, pH 7.4). The proteins were subjected to SDS-PAGE, and were then transferred to nitrocellulose membranes. The latter were incubated with biotinylated RCA (20 μg/mL, Vector Labs). A loading control was monitored by the expression of 14-3-3ζ. Immunoreactive bands were visualized using Enhanced Chemiluminescence Detection Reagents (Pierce). Images of the chemiluminescent signal were captured using G:BOX Chemi XT16 Image Systems software and quantified using Gene Tools software (version 4.0.0.0, Syngene). MW: molecular weights of the protein ladder. D) Measurements of platelet life span in mice. Washed platelets were first stained with 5-chloromethylfluorescein diacetate (CMFDA, 10 mM), washed and then intravenously injected in male NOD SCID gamma mice as a single bolus (108 CMFDA-labeled platelets). Human platelets were monitored by flow cytometry of whole blood samples collected at 1 min and 90 min after injection. The proportion of fluorescent platelets at 90 min was calculated as a percentage of the fluorescent platelets at 1 min. Four mice were injected with 108 platelets from a control, and four other mice were injected with 108 platelets from patient II:1. In the scatter plot, each dot represents a mouse. E) Measurement of proplatelet formation. CD34+ cells were isolated from peripheral blood using an immunomagnetic technique (Miltenyi Biotec). Human TPO (50 nM) was added once to the culture medium on day 0, followed by 20 nM TPO on day 6. On day 12. The MKs were then observed and stained for α-tubulin (magnification: 600x, bottom panel). The coiled element diameters were then measured (right panel). The quantitative data are presented in box and whisker plots; the lower hinge represents the 25th percentile, and the upper hinge represents the 75th percentile. The line within the box marks the median, and the mean is represented by a cross (+). The maxima and minima are at the ends of the whiskers (n=65 MKs in control 1, 31 in control 2, 96 in control 3, and 53 for patient II:1).

