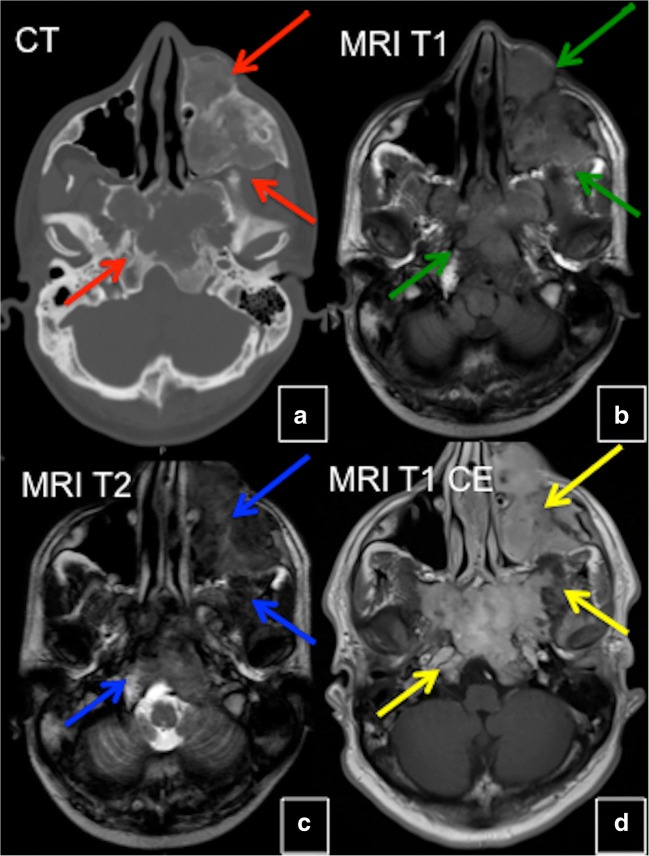
Fig. 8.
CT and MRI in craniofacial fibrous dysplasia (FD). a CT demonstrates mixed sclerotic FD lesions involving the skull base (red arrows). b Lesions demonstrate intermediate signal intensity on T1 weighted MRI (green arrows). On T2 weighted images lesions demonstrate heterogeneous hypointense/intermediate signal intensity (blue arrows). d FD lesions show slightly heterogeneous enhancement (yellow arrows)

