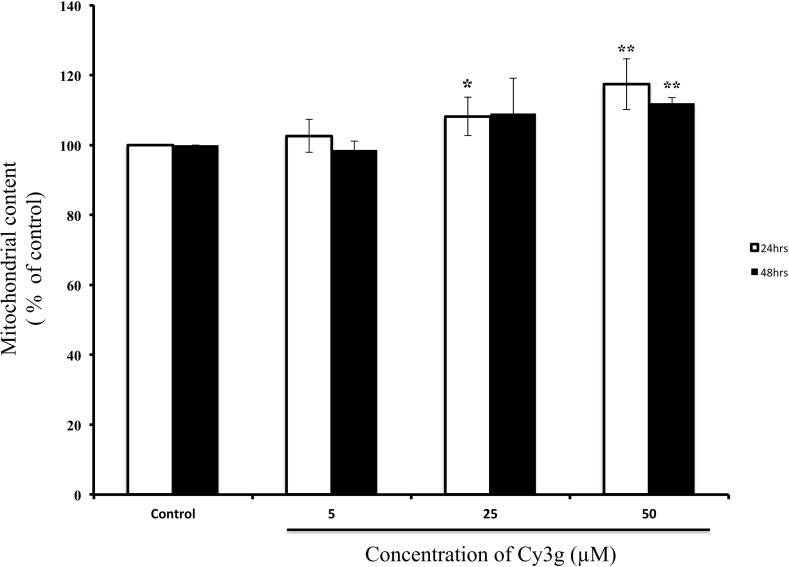
Fig. 3.
Measurement of the mitochondrial content in the HuH7 adult human hepatoma cell line cultured without Cy3g (control) or with different concentrations of Cy3g (5, 25 or 50 µM) for different time periods (24 or 48 h). Values represent the means of three independent experiments ± standard deviation. Bars with asterisks are significantly different from the control at P ≤ 0.05 (*) or P ≤ 0.01 (**)

