Fig. 2.
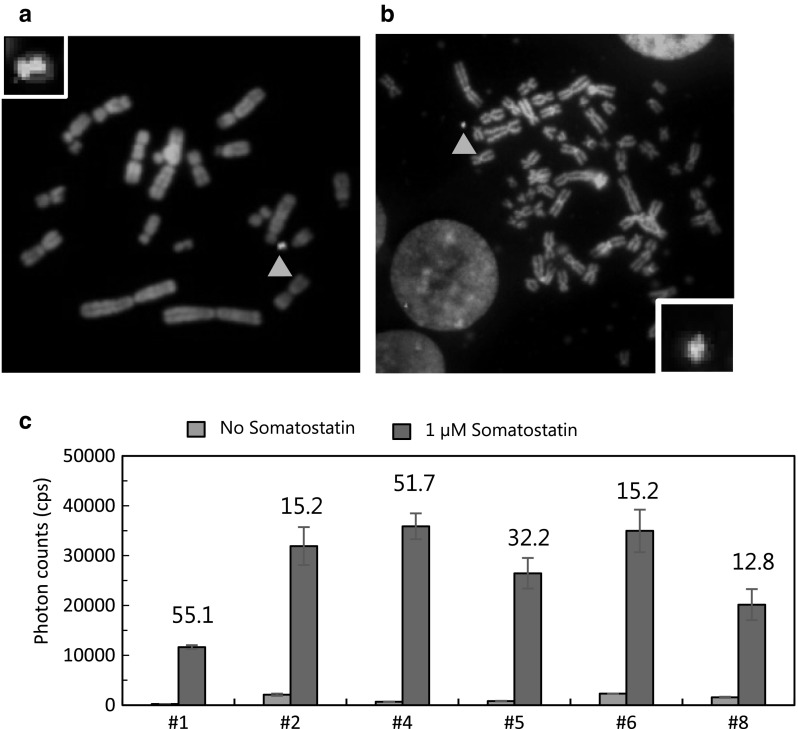
Evaluation of luciferase activity of Eluc-N-ARRB1 expressed from the MAC vector in CHO and HEK293 cells. a Representative metaphase of CHO cells containing MAC4 loaded with the NEluc-ARRB1 expression unit (clone #26). Red: mouse cot-1 indicates the MAC; Yellow (merged green): NEluc-ARRB1 plasmid vector probe indicates the presence of NEluc-ARRB1 DNA. Red arrowhead shows the MAC. Inset: an elongated MAC vector. b Representative metaphase of HEK293 cells containing MAC4 loaded with the NEluc-ARRB1 expression unit (clone #5). c Measurement of luciferase activity in HEK293 clones containing ARRB1-MAC4. The cells were transiently transfected with SSTR2-CEluc and treated with/without 1 µM somatostatin for 20 min. Then, the luciferase activity was measured. Blue bars: background photon counts without stimulation by the ligand. Red bars: signal photon counts with stimulation by the ligand. The number above the bar is the signal/background (S/B) ratio. Error bars: standard error of the mean (n = 3). (Color figure online)

