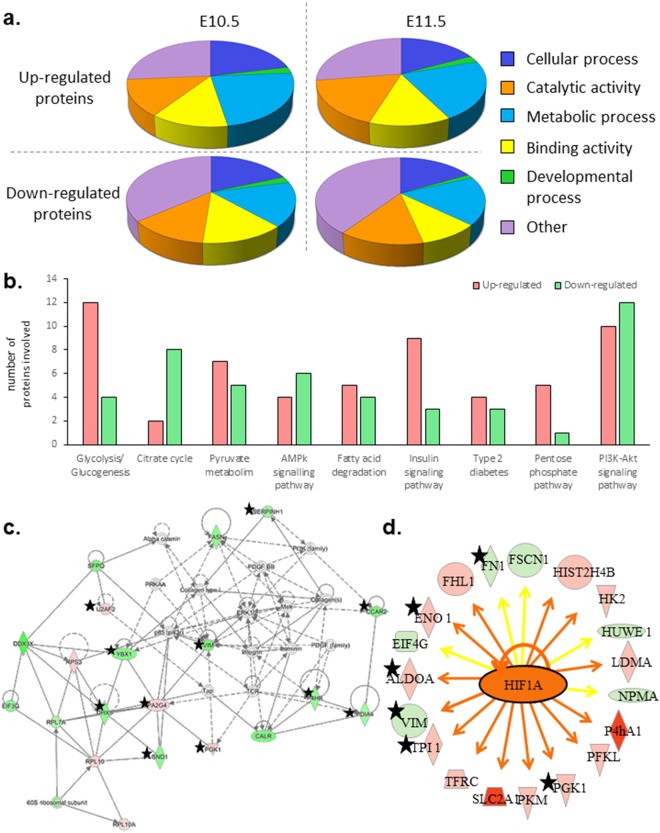
Figure 4.
(a) Diagrams showing the significant biological processes in which dysregulated proteins were involved, according to Panther classification system. Proteins up and down-regulated have been analyzed separately. Metabolic processes, developmental functions and cellular component organization or biogenesis were enriched in all conditions. (b) Histogram presenting the most enriched sub-functions of metabolic processes following STRING software analysis of all dysregulated proteins after 1 and 2 days of prenatal ATRA treatment. 76 dysregulated proteins following ATRA treatment were involved in metabolic processes. Red bars represented the number of up-regulated proteins, the green bars the down-regulated ones. (c) «Protein Synthesis, Cell Death and Survival, Cancer» network. According to IPA analysis, it was one of the major network in which proteins dysregulated by antenatal ATRA (after both one and 2 days) are involved. Up-regulated proteins are framed in red and down-regulated proteins in green. (d) HIF1A and its network from IPA analysis of proteomics data. Up-regulated proteins are in red and down-regulated proteins in green. In orange, HIF1A is predicted to be activated at E10.5 (1 day of ATRA 100-treatment). The orange arrows referred to activation, whereas yellow arrows evoked an inconsistent finding with state of downstream molecule. The stars highlighted proteins dysregulated in the same way after 1 and 2 days of ATRA-100 treatment.

