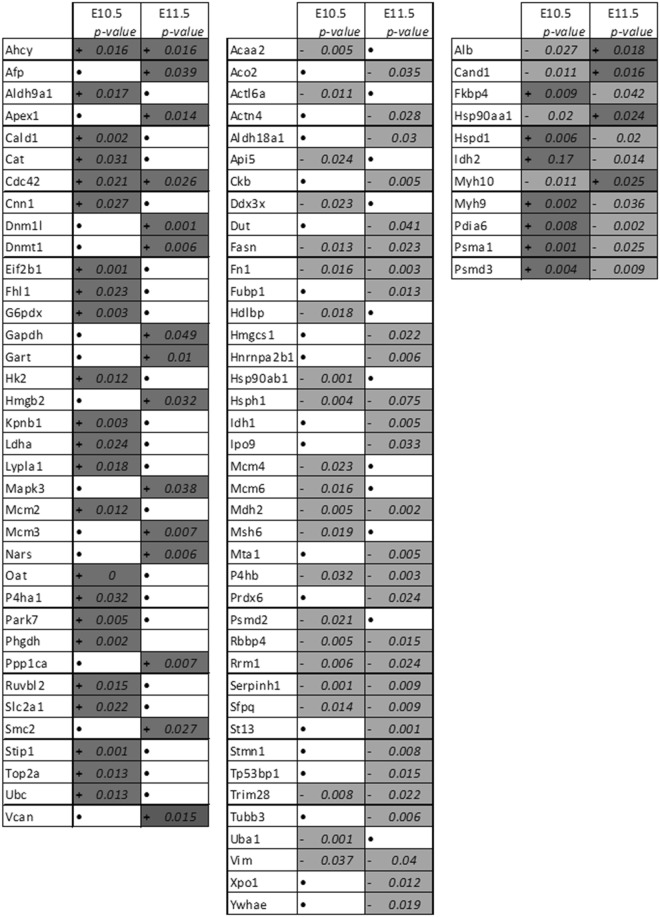
Figure 5.
Proteins involved in TP53 pathway (apoptosis) following IPA analysis. Activated (+) or inhibited (−) proteins involved in TP53 pathway have been revealed by IPA analysis. and light-gray boxes represent respectively an increase and a decrease of protein expression observed by proteomics analysis at E10.5 and E11.5 (after 1 and 2 days of ATRA treatment). (FDR < 0.05) No significant variation by LC/MS-MS analysis are represented by •.

