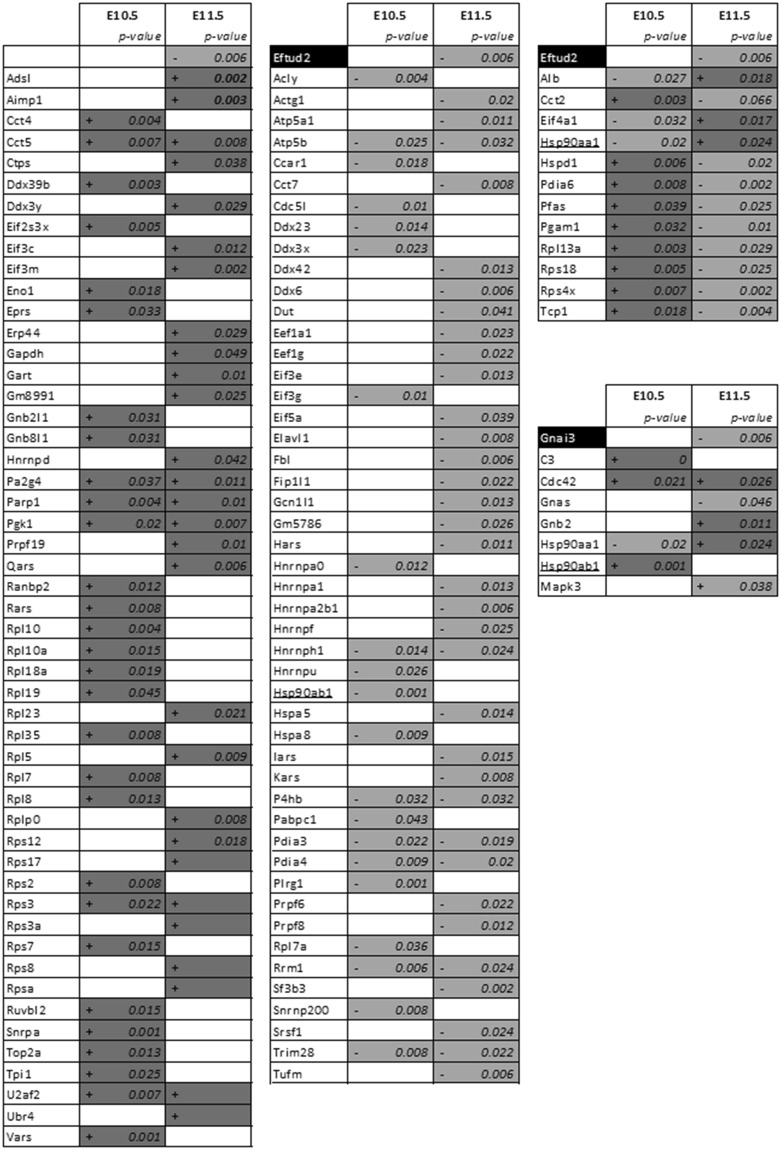
Figure 7.
Up and/or down-regulated proteins by ATRA treatment linked with Eftud2 and Gnai3 respectively following STRING software analysis. STRING analysis with mus musculus as reference is performed on all dysregulated proteins identified by our proteomics analysis at E10.5 and E11.5 following ATRA treatment at E9.5. Of all the deregulated proteins, those directly linked with Eftud2 (three right panels) and Gnai3 (fourth panel) are reported in this table. Dark-gray (+) and light-gray (−) represent respectively an increase and a decrease of protein expression by LC-MS/MS analysis. Hsp90ab1 and Hsp90ab1 underlined were linked to both Eftud2 and Gnai3 following STRING analysis

