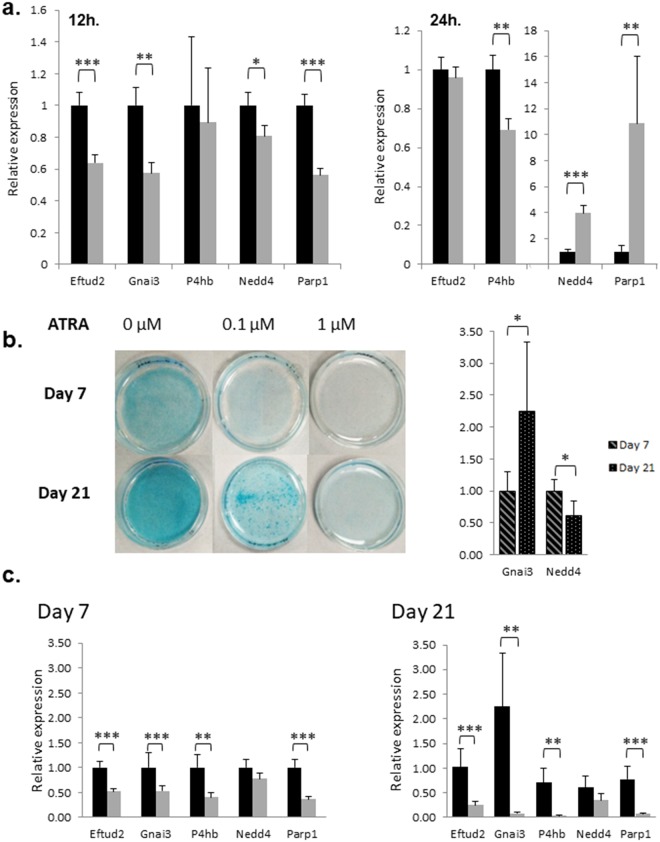
Figure 8.
(a) In vitro RT-qPCR analysis of target genes following ATRA treatment of ATDC5 cells. Relative genes expression of Eftud2, Gnai3, P4hb, Nedd4 and Parp1 following 12 h and 24 h of 1 µM ATRA treatment. Black bars represented control relative mRNA expression although gray bars shown mRNA expression following 1 µM ATRA treatment. (b) Peptidoglycans coloration of ATD5 cells by Alcian Blue 7 and 21 days after ATRA treatment and in vitro RT-qPCR analysis of targets genes during differentiation. The peptidoglycans accumulation in extra-cellular matrix was used as an index of ATDC5 differentiation into chondrocytes lineage shown by a blue coloration becoming more intense following days. Qualitative analyze suggests an inhibition of ATDC5 differentiation by ATRA. Relative genes expression of Gnai3 and Nedd4 during ATDC5 differentiation, at 7 and 21 days in control condition (no ATRA-treatment). Light turquoise bars represented relative mRNA expression at Day 7 although dark turquoise bars shown mRNA expression at Day 21. (c) In vitro analysis of target genes expression during ATDC5 differentiation and ATRA chronic treatment. Relative genes expression of Eftud2, Gnai3, P4hb, Nedd4 and Parp1 at Day 7 and Day 21 of ATDC5 differentiation. Impact of 1 µM of ATRA chronic treatment on their expression is also analyzed. Black bars represented control relative mRNA expression although gray bars shown mRNA expression following 1 µM ATRA treatment. Quantitative expression of studied genes was determined using the 2−ΔΔCt method. Statistical significance was evaluated using t-test (*P < 0.05; **P < 0.01; ***P < 0.001; n = 4).

