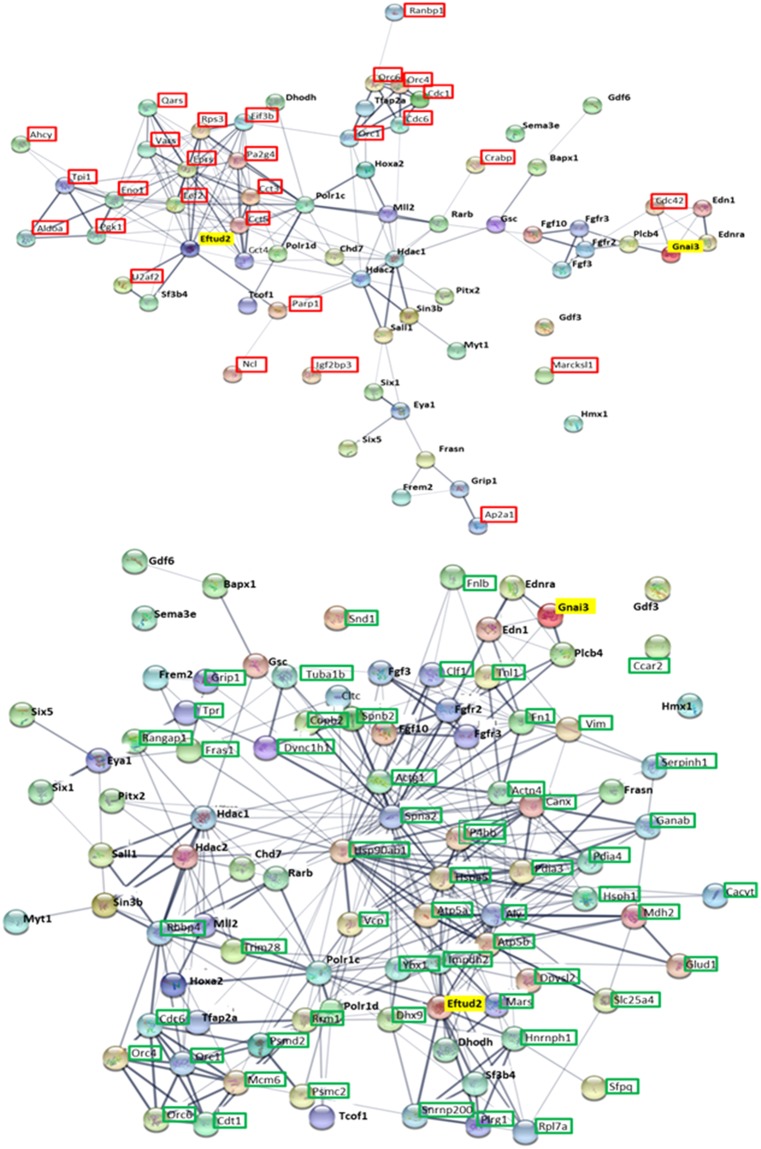
Figure 9.
Interactions between proteins whose selected genes6 are involved in craniofacial developmental diseases and proteins found dysregulated following ATRA treatment (both 1 and 2 days). The Networks were obtained by STRING network analysis. Proteins framed in red are up-regulated (up panel) whereas proteins down-regulated are framed in green (down-panel), at both experimental times. Gnai3 and Eftud2, involved in craniofacial syndromes were also found repressed after 2 days of ATRA treatment (highlighted in yellow).

