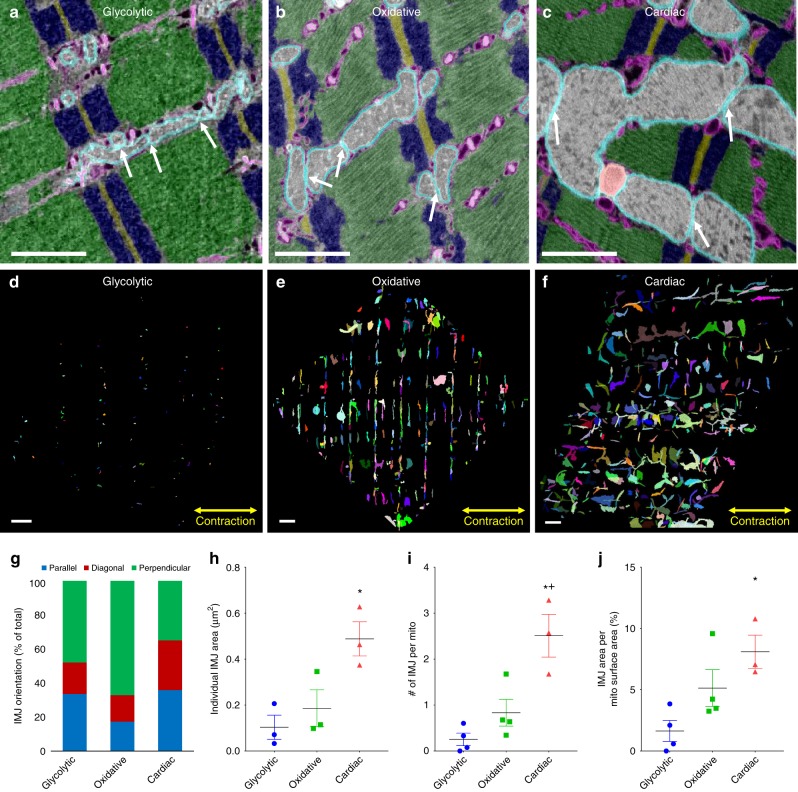
Fig. 3.
Intermitochondrial junction morphology varies by muscle type. a Overlay of raw and segmented single image from glycolytic muscle SBF-SEM volume highlighting intermitochondrial junctions (IMJs, white arrows). Outer mitochondrial membrane – cyan, mitochondrial interior – gray, sarcoplasmic reticulum and t-tubules – magenta, z-disks – brown, I-bands – blue, A-bands – green. b Segmented and raw single image from oxidative muscle FIB-SEM volume highlighting IMJs. c Segmented and raw single image from cardiac muscle FIB-SEM volume highlighting IMJs. d–f Maximum projections of all glycolytic (d), oxidative (e), and cardiac (f) muscle IMJs. g Quantification of IMJ orientation. h Individual IMJ sizes. glycolytic, n = 170 IMJs, 3 datasets; oxidative, n = 952 IMJs, 3 datasets; cardiac, n = 2403 IMJs, 3 datasets. i Number of IMJs per mitochondria. glycolytic, n = 1336 mitochondria, 4 datasets; oxidative, n = 2623 mitochondria, 4 datasets; cardiac, n = 1890 mitochondria, 3 datasets. h IMJ Area per mitochondrial surface area. glycolytic, n = 1336 mitochondria, 4 datasets; oxidative, n = 2623 mitochondria, 4 datasets; cardiac, n = 1890 mitochondria, 3 datasets. Points are means for each dataset. Bars represent muscle type overall mean ± SE. *Significantly different from glycolytic, +significantly different from oxidative. Significance determined as p < 0.05 from one way ANOVA with Tukey’s HSD (variances not different) or Dunn’s multiple comparisons (variances different) post hoc tests. Scale bars – 1 µm

