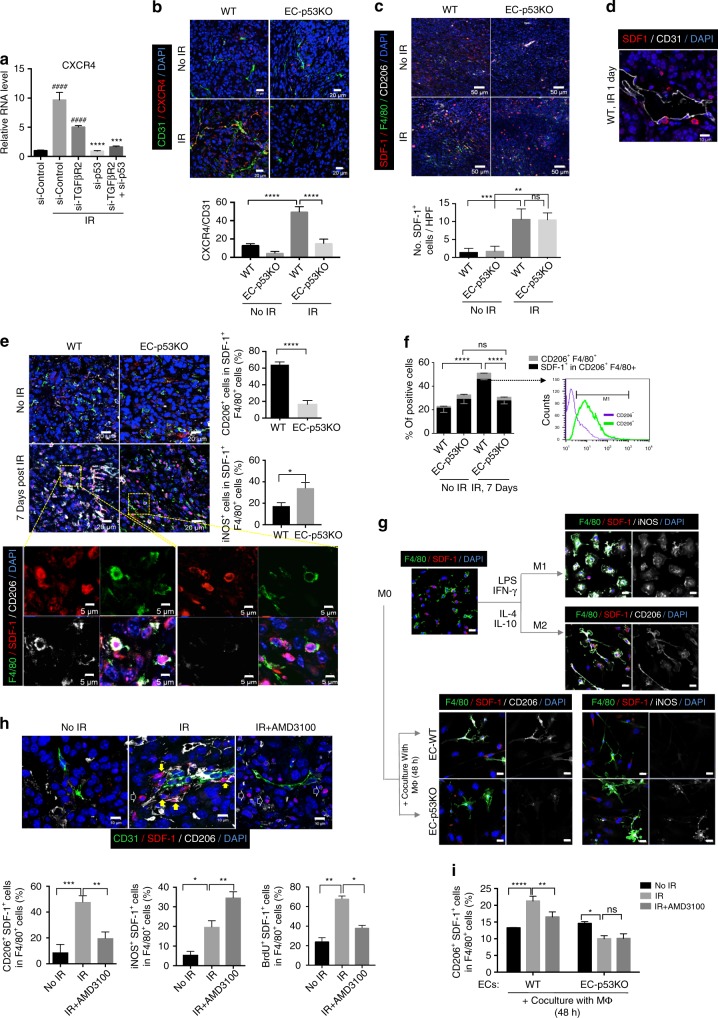
Fig. 6.
EC-Trp53 deletion attenuates endothelial CXCR4 expression and M2 polarization of SDF-1+ TAMs after a single 20-Gy irradiation. a RT-qPCR analysis of CXCR4 in HUVECs 48 h post 10 Gy irradiation. HUVECs were transfected with TGFβR2, Trp53, or TGFβR2+Trp53 siRNAs 2 days before irradiation. si-TGFβR2 + IR or si-Control + IR versus si-Control group, ####p < 0.0001.si-p53 + IR or si-TGFβR2+si-p53 + IR versus si-Control + IR or si-TGFβR2 + IR group, respectively, ***p < 0.001 and ****p < 0.0001. b Immunofluorescence of CD31 and CXCR4 in KP tumours. CXCR4+CD31+ cell quantitation (magnification, ×200) is shown. Scale bar = 20 μm. c Immunofluorescence of SDF-1, F4/80, and CD206 in KP tumours, with or without irradiation (23 dpi). Quantification of SDF-1+ cells (magnification, ×200) is shown. Scale bar = 50 μm. d Immunofluorescence of SDF-1 and CD31 in KP tumours from WT mice 1 dpi. Scale bar = 10 μm e Immunofluorescence of F4/80, SDF-1, and CD206 in KP tumours 7 dpi. Scale bar = 20 μm (crop, 5 μm). Quantification of CD206+ and iNOS+ cells among SDF-1+F4/80+ cells (magnification, ×200). f Flow-cytometric analysis of SDF-1+ cells in CD206+F4/80+ cells of KP tumours at 7 dpi. g Immunofluorescence of F4/80, SDF-1, and CD206 in BMDMs after a 48-h coculture with KP tumour-derived ECs. As controls, BMDMs from WT mice were polarized to M1 or M2 macrophages by treatment with LPS (100 ng/ml) plus IFNγ (20 ng/ml), or IL-10 (20 ng/ml) plus IL-4 (20 ng/ml), respectively, for 48 h. Scale bar = 20 μm. h Immunofluorescence of CD31, SDF-1, and CD206 in KP tumours from WT mice at 7 dpi, with or without AMD3100 treatment. BrdU was used for in vivo proliferation assays. CD206+SDF-1+ TAMs, iNOS+SDF-1+ TAMs, and non-differentiated SDF-1+ monocytes are marked with yellow, green, and open arrows, respectively. Quantification of CD206+SDF-1+ and iNOS+SDF-1+ cells among F4/80+ cells (magnification, ×200) and flow-cytometric analysis of BrdU+SDF-1+ cells in F4/80+ cells. Scale bar = 10 μm. i Flow-cytometric analysis of SDF-1+CD206+ cells in F4/80+ cells of WT BMDMs after coculture with KP tumour-derived ECs from WT and EC-p53KO mice for 48 hpi, with or without AMD3100 treatment. Error bars indicate SD (a) or SEM (c, e, f, h, i); *p < 0.05, **p < 0.01, ***p < 0.001, ****p < 0.0001, ns not significant (one-way ANOVA). Data are representative of three independent experiments

