Fig. 1.
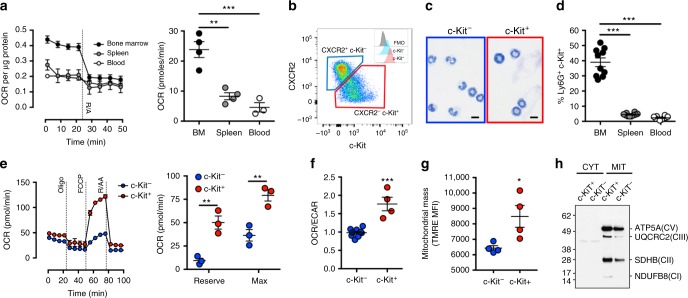
c-Kit is a marker of immature oxidative neutrophils. a Determination of C57BL/6J neutrophil basal mitochondrial oxygen consumption rates (OCR, left) following inhibition of electron transport chain components (Rotenone 100 nM and antimycin A 1 µM). Quantification of basal mitochondrial OCR from multiple independent experiments (right). Data were analysed by one-way ANOVA with Tukey’s post-tests indicated. Bone marrow and spleen n = 4, blood n = 3. b Representative flow cytometry plot of Ly6G+ neutrophils displaying c-Kit+ CXCR2− and c-Kit− CXCR2+ populations from naive C57BL/6 bone marrow. Histograms represent c-Kit expression of populations. c Representative nuclear morphology of bone marrow neutrophils following cytospin and Romanowsky staining. Scale bar represents 10 μm. d Percentage of neutrophils expressing c-Kit isolated from different tissues (BM—bone marrow). Data (n = 10 per group) represents two independent experiments, data were analysed by one way ANOVA, Tukey’s post-tests are indicated on the graph. e Representative mitochondrial stress test (left) in bone marrow neutrophils (oligomycin 1.26 µM, Carbonyl cyanide-4-(trifluoromethoxy) phenylhydrazone (FCCP) 660 nM, Rotenone 100 nM and antimycin A 1 µM). Mitochondrial reserve and maximal OCR are quantified from multiple independent experiments (right). Data (n = 3 per group) were analysed by two-way ANOVA with Tukey’s post-tests indicated. f OCR:extracellular acidification rate (ECAR) ratios of neutrophil subsets. Data (c-Kit+ n = 3, c-Kit− n = 9) were analysed by Student's t-test and is representative of three independent experiments. g Median fluorescent intensity of tetramethylrhodamine ethyl ester (TMRE) staining, which indicates active mitochondrial content in neutrophil subsets. Data were analysed by Student's t-test, data (n = 4 per group) represents two independent experiments. h Western blotting for mitochondrial complexes I (NDUFB8), II (SDHB), III (UQCRC2) and V (ATP5A) in neutrophil subsets. CYT cytosolic, MIT mitochondrial. Data is representative of two repeats (n = 3). p Values *<0.05, **<0.01, ***<0.001. All error bars represent the mean ± SEM

