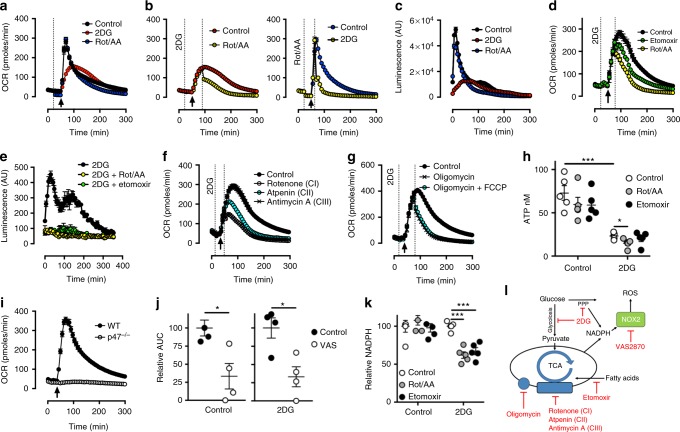
Fig. 2.
Neutrophil mitochondria facilitate free radical production. a C57Bl/6J bone marrow neutrophil respiratory burst was measured by oxygen consumption rate (OCR) in response to phorbol 12-myristate 13-acetate (PMA) at the arrow following the addition of indicated compounds at the dotted line. b Following stimulation as described in panel (a), neutrophils received a second stimulation of indicated compounds at the second line. Control from panel (a). c H2O2 production from bone marrow neutrophils in response to PMA 20 min after the addition of the indicated individual compounds. d OCR in response to the indicated compounds at the second line following the addition of PMA (arrow) and 2DG (first line). e H2O2 production in response to PMA 20 min after addition of 2DG alone or in combination with the indicated compounds. f OCR values in response to Inhibitors to electron transport chain complexes (CI-III) added at the second line following stimulation with PMA (arrow) and 2DG (first line). g OCR in response to the complex V inhibitor Oligomycin and Carbonyl cyanide-4-(trifluoromethoxy)phenylhydrazone (FCCP) were added at the second line, following stimulation with PMA (arrow) and 2DG (first line). h ATP content of PMA-stimulated bone marrow neutrophils following inhibition with indicated compounds in the presence or absence of 2DG. Data (n = 5 per group) were analysed by two-way ANOVA with Tukey’s multiple comparisons indicated. i OCR in p47−/− neutrophils in response to PMA (arrow). j Relative total oxygen consumption in response to PMA during NADPH oxidase inhibition by VAS-2870 in the presence or absence of 2DG. Data were analysed by Student's t-test. Control n = 3 pooled from three independent experiments, 2DG n = 4 pooled from two independent experiments. k Relative NADPH levels in PMA-stimulated neutrophils in the presence or absence of 2DG following treatment with indicated compounds. Data (n = 5) representative of two independent experiments and were analysed by two-way ANOVA with Tukey’s multiple comparisons indicated. l Schematic displaying our metabolic model of ROS support, with indicated inhibitors. Concentrations were: Rotenone (Rot, 100 nM), Atpenin (1 µM), Antimycin A (AA, 1 µM), 2-DG (100 mM), PMA (1 µg/ml), FCCP (660 nM), etomoxir (100 µM), Oligomycin (1.26 µM), and VAS-2870 (10 μM). p Values *<0.05, ***<0.001. All error bars denote the mean ± SEM

