Figure 6.
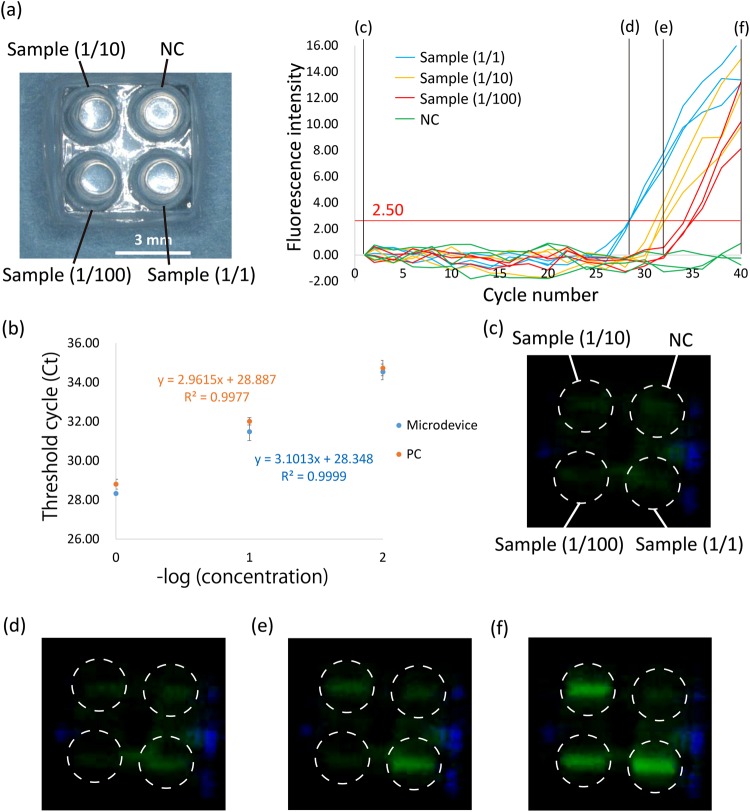
qRT-PCR on the microdevice. (a) Increase in the fluorescence intensity per PCR thermal cycle. We applied samples that were diluted 1/1, 1/10, or 1/100 (final RNA concentration: 5 ng/μl, 0.5 ng/μl, or 50 pg/μl) or MilliQ water as the NC. The sample was purified from the HepG2 cell line using the purification microdevice, and the expression level of miR-224 was analysed. The red line shows the fluorescence threshold line (=2.50). (b) Real-time PCR standard curve extracted from results in (a) showing the Ct as a function of –Log (cDNA concentration). PC represents the results obtained when we performed the same experiment on the conventional device. The fluorescence threshold line of PC was 0.07. The PC results are shown in Supplementary Fig. 1. The error bars represent standard deviation. (c–f) Images captured by the CMOS image sensor at the 1st, 28th, 32nd, or 40th PCR thermal cycle, respectively. The white dotted lines shows the position of wells.

