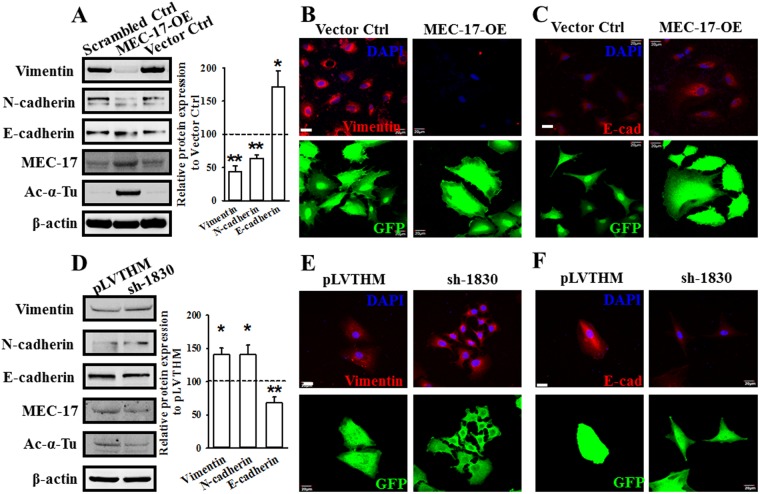
Figure 4.
MEC-17 modulates cell motility through EMT suppression. (A) Western blots showed the protein levels of vimentin, N-cadherin, E-cadherin, MEC-17, and acetyl-α-tubulin in scrambled control or vector control and MEC-17-overexpressed A549 cells. Beta-actin served as the internal control. Representative bar graph quantification depicting levels of vimentin, N-cadherin and E-cadherin showed the repression of EMT process in MEC-17-overexpressed A549 cells. *P < 0.05, **P < 0.01 in a one-way ANOVA. Uncropped blots are displayed in the supplementary information (Supplementary Fig. S3). (B) The representative doubling immunofluorescence images show the intensity of vimentin (red, top panels) and cell morphological marker GFP (bottom panels) in A549 cells stably expressing the vector control or MEC-17-overexpressed constructs. Scale bar, 20 μm. (C) The representative doubling immunofluorescence images show the intensity of E-cadherin (E-cad, red, top panels) and cell morphological marker GFP (bottom panels) in A549 cells stably expressing the vector control or MEC-17-overexpressed constructs. Scale bar, 20 μm. (D) Western blots show the protein levels of vimentin, N-cadherin, E-cadherin, MEC-17, and acetyl-α-tubulin from pLVTHM and MEC-17-knockdown (sh-1830) A549 cells lysts. Beta-actin served as the internal control. Representative bar graph quantification depicting amounts of vimentin, N-cadherin and E-cadherin showed the promotion of EMT process in MEC-17-knockdown A549 cells. *P < 0.05, **P < 0.01 in a one-way ANOVA. Uncropped blots are displayed in the supplementary information (Supplementary Fig. S3). (E) The representative doubling immunofluorescence images show the intensity of vimentin (red, top panels) in A549 cells stably expressing the pLVTHM or sh-1830 constructs. The GFP fluorescence images (bottom panels) were used for transduction control and morphology of A549 cells. Scale bar, 20 μm. (F) The representative doubling immunofluorescence images show the intensity of E-cadherin (E-cad, red, top panels) in A549 cells stably expressing the pLVTHM or sh-1830 constructs. The GFP fluorescence images (bottom panels) were used for transduction control and morphology of A549 cells. Scale bar, 20 μm.

