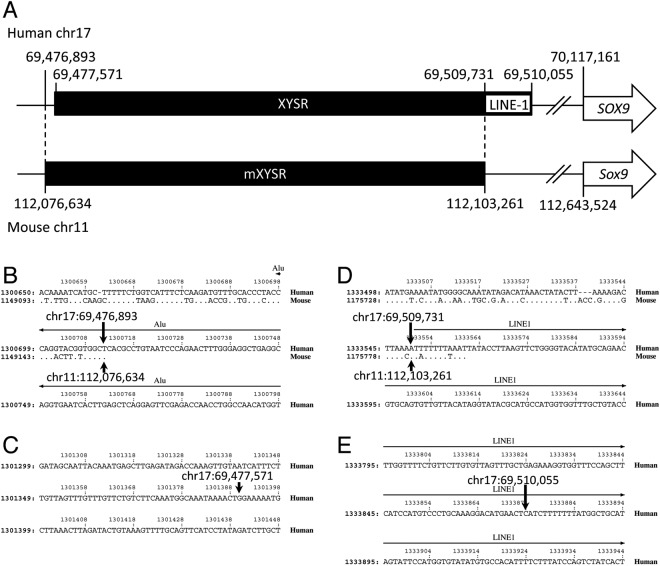
Figure 1.
Identification of mXYSR. (A) Schematic representation of the XYSR/mXYSR region. Black bar, black box, white box and arrow indicate the genome, XYSR/mXYSR, LINE-1 element and SOX9/Sox9. Positions are shown with vertical bars and numbers. (B–E) Results of Pipmaker analysis. The centromeric termini of mXYSR (B) and XYSR (C) and the telomeric termini of mXYSR (D) and XYSR (E) are shown. Human and mouse sequences are shown at the top and bottom, respectively. Conserved nucleotides are indicated by dots on the mouse sequence. Hyphens indicate sequences that only exist in the human or mouse. In the non-conserved regions, only the human sequence is shown. Numbers at the top and left are nucleotide positions of query sequences used for the analysis. Horizontal arrows show the area of repetitive sequences. Arrows pointing up and down indicate the positions of edges of XYSR and mXYSR, respectively.

