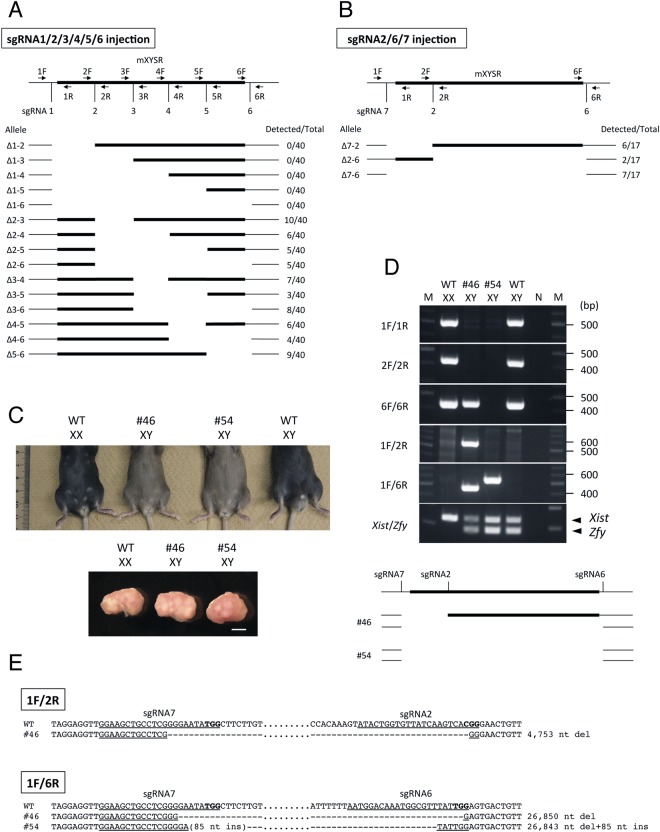
Figure 2.
Generation of mutant mice using series deletion. (A,B) Schematic representation of series deletion made using sgRNA1-6 (A) sgRNA2/6/7 (B). Black bar and black box indicate genome and mXYSR, respectively. PCR primers and sgRNAs are demarcated with arrows and vertical bars. Allele names and numbers of mice are shown at left and right, respectively. WT: wild-type. (C) Phenotype of mutant mice. External and internal genitalia are shown at top and bottom, respectively. Genotype or ID of mice, and karyotype are shown at top of each photo. WT: wild type. Scale bar: 1 mm. (D) Electrophoresis of PCR genotyping (top) and schematic representation of deleted regions of mutant mice (bottom). Genotypes or IDs of mice, and karyotypes are shown at top. Primer sets are indicated to the left. Sizes of DNA markers are shown on the right. Positions of Xist and Zfy PCR products are indicated with arrowheads at right. Full agarose gel images of (D) are shown in Supplementary Fig. S1. M: DNA marker; N: negative control; WT: wild type. In the bottom figure, the black bar and box are similar to those described for (A). Positions of sgRNAs and mouse IDs are designated at the top and left, respectively. (E) Nucleotide sequences of deleted alleles. Sequences of PCR products amplified with primer pairs 1 F/2 R and 1 F/6 R are shown. The pairs of PCR primers used are shown with boxes. Mouse IDs and genotypes are shown on the left and right, respectively. Underlined are the positions of each target sequence of sgRNAs. A parenthesis shows unexpected nucleotide insertion. Bold letters indicate PAM sequence. Hyphens: deleted nucleotides; ins: insertion; del: deletion.

