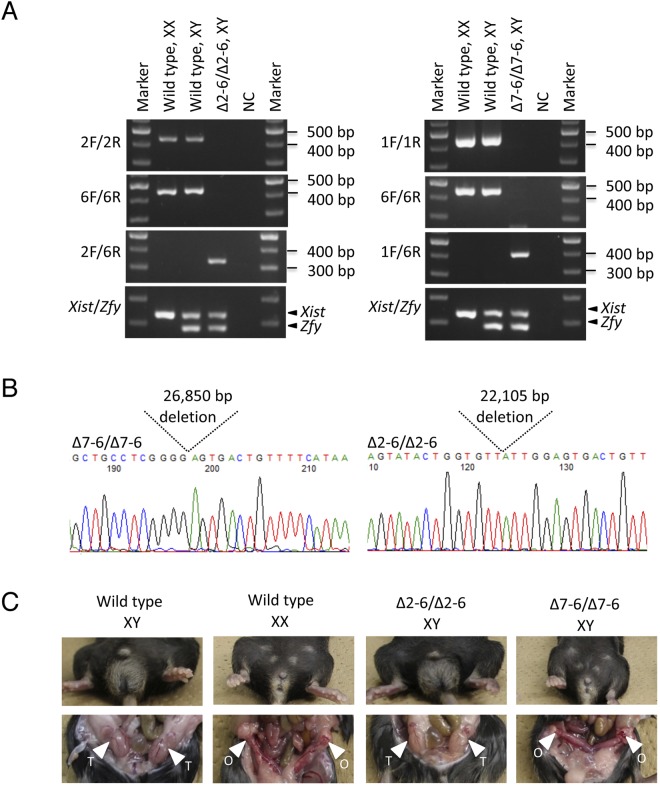
Figure 3.
Phenotypic analysis of homozygous mutants. (A) Electrophoresis of PCR genotyping. Genotypes and karyotypes are shown at the top. Primer sets are indicated to the left. Positions of Xist and Zfy PCR products are indicated with arrowheads at the right. Sizes of DNA markers are shown on the right. NC: negative control. Full agarose gel images of left and right part of (A) are shown in Supplementary Figs S2 and S3, respectively. (B) Sequences of deleted alleles are shown with electropherograms. Genotypes are indicated at top left. Positions of deleted sequences are indicated with dotted lines. The deleted lengths are shown between dotted lines. (C) Phenotype of mutant mice. Genotypes and karyotypes are shown at top. Testis and ovary are indicated with arrowheads labeled T and O, respectively.

