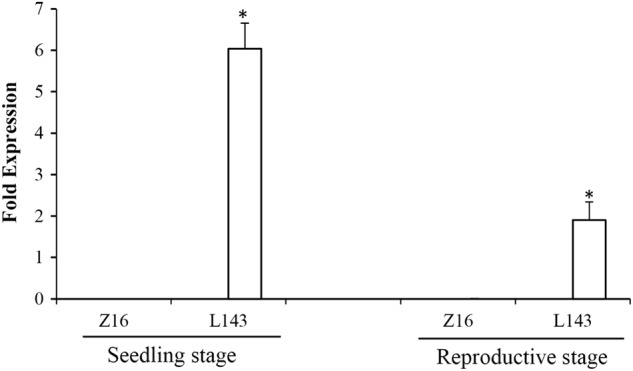
Fig. 7. Expression profile of BrMAM-3 gene at the seedling and reproductive stages in accessions Z16 and L143.

Real-time quantitative PCR (qRT-PCR) was conducted, and the expression levels of BrMAM-3 in L143 siliques are indicated. Error bars represent the standard deviation (SD) of three biological repeats. Asterisks indicate significant differences in the expression profile of the BrMAM-3 gene compared to the Z16 accession (P < 0.05, determined by one-way ANOVA)
