Fig. 2.
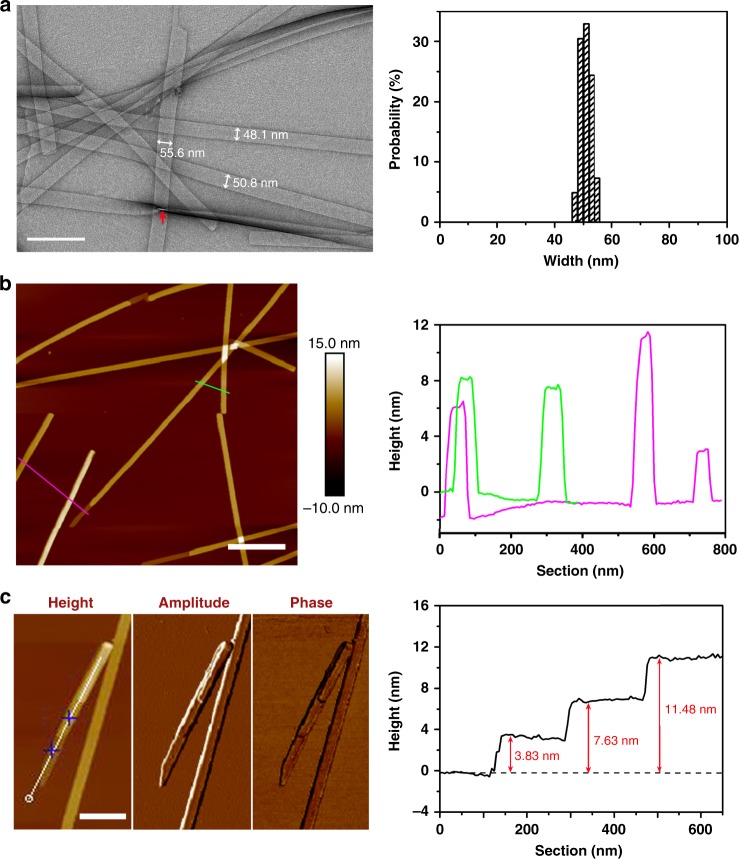
Nanoribbons formed by 8 mM Ac-I3QGK-NH2 at pH 7.0 after incubation for 1 week. a TEM micrograph (left panel) and width distribution histogram (right panel, based on measurements of ~100 individual ribbons). Scale bar, 200 nm. b Tapping-mode height AFM image (left panel) and representative cross-sectional height profiles (right panel). Scale bar, 500 nm. c Higher magnification tapping-mode AFM images (left panel: height, amplitude, and phase) and a height profile along the ribbon axis (right panel). Scale bar, 200 nm

