Fig. 6.
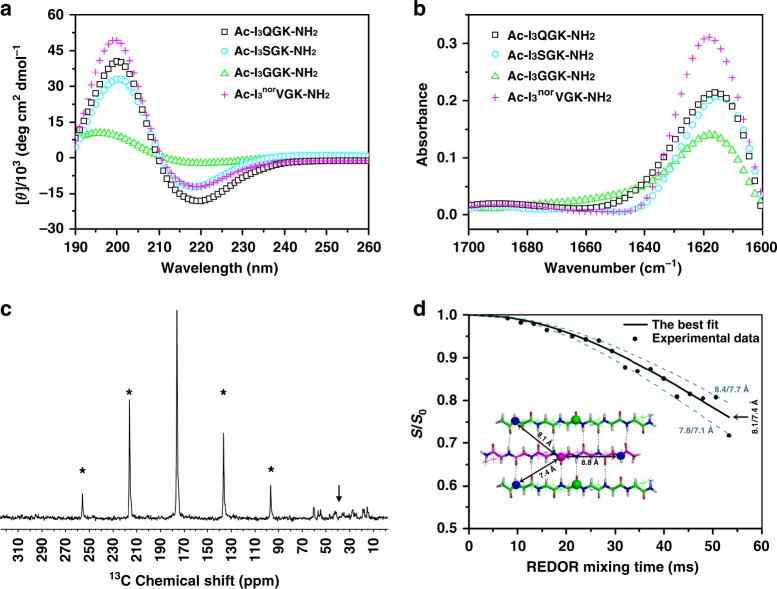
Secondary structures and molecular packing modes. a, b CD and FTIR spectra of the designed peptides at 8 mM except for Ac-I3GGK-NH2 at 16 mM. For clarity, the CD spectra of Ac-I3NGK-NH2 and Ac-I3LGK-NH2 are given in Supplementary Figures 3b and 6b, respectively, but also indicating the formation of β-sheet conformations. c 1H-13C CP spectrum of [15N]Ile1[1-13C]Ile3-Ac-I3QGK-NH2 nanoribbons. Rotational sidebands are denoted by asterisks and the down arrow denotes natural abundance 13C signals. d Experimental 13C{15N} REDOR data (black dots) of [15N]Ile1[1-13C]Ile3-Ac-I3QGK-NH2 nanoribbons. The REDOR curve (black solid line) was fitted by SIMPSON using one intra-strand and two inter-strand 13C-15N spin pairs with corresponding 13C-15N distances of 8.8, 7.4, and 8.1 Å, respectively, which were extracted from the one-residue shift packing mode (inset). The anti-parallel trimer with one-residue shift shown in the inset (13C: pink or green sphere and 15N: blue sphere) was the central core of an Ac-I3QGK-NH2 oligomer of 6 strands × 4 sheets during MD simulations. To demonstrate fitting uncertainty, the dashed lines were calculated using the indicated inter-strand 13C-15N distances

