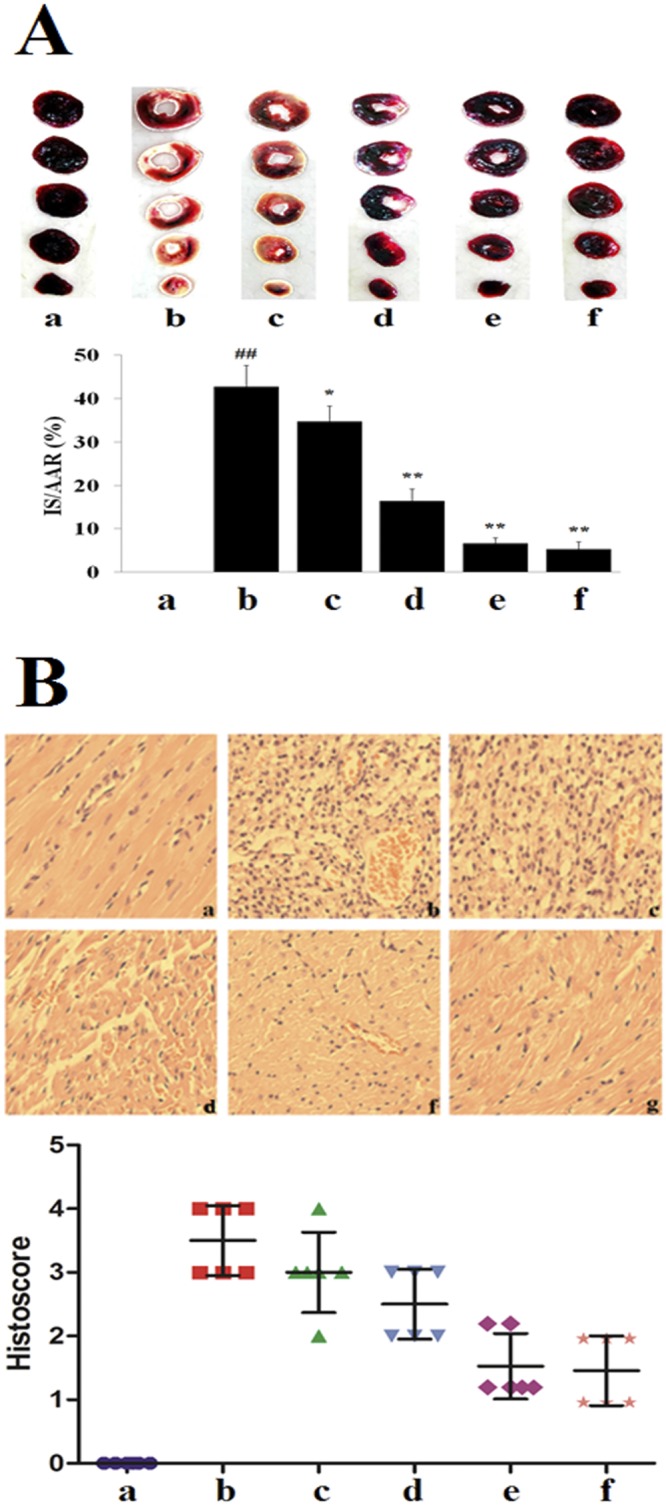
Figure 2.

Myocardial infarct size and histological characterization in MIRI rats. (A) Images of TTC stained heart sections, and the quantitative analysis, TTC stains living tissue as deep red color while necrotic tissue is TTC negative and appears as white color. The infarcted area is marked with a red line (a: Sham; b: MIRI; c: L-TFDM; d: M-TFDM; e: H-TFDM; f: Control drug, ##P < 0.01; *P < 0.05; **P < 0.01, n = 10). (B) Histological characterization in the hearts of MIRI rats. Magnification ×40 (A, a: Sham; b: MIRI; c: L-TFDM; d: M-TFDM; e: H-TFDM; f: Control drug) (Scatter plot of histoscore. n = 10 rats in each group).
