
Figure 6.
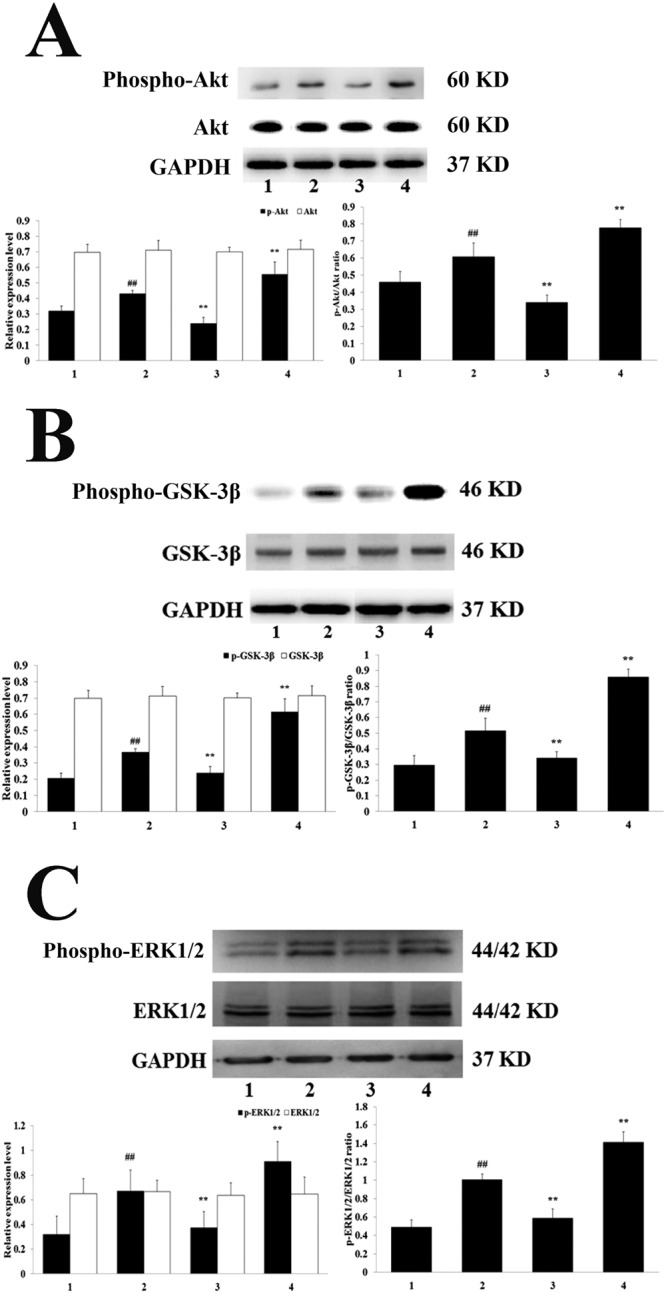
Phospho-Akt and Akt expression, Phospho-GSK-3β and GSK-3β expression and Phospho-ERK1/2 and ERK1/2 expression in MIRI rats. (A) Phospho-Akt and Akt assay (1–4, represent results of Sham, MIRI, H-TFDM + MIRI + LY294002, H-TFDM + MIRI group, respectively, ##P < 0.01; *P < 0.05; **P < 0.01, n = 10). (B) Phospho-GSK-3β and GSK-3β assay (1–4, represent results of Sham, MIRI, H-TFDM + MIRI + LY294002, H-TFDM + MIRI group, respectively, ##P < 0.01; *P < 0.05; **P < 0.01, n = 10). (C) Phospho-ERK1/2 and ERK1/2 assay (1–4, represent results of Sham, MIRI, H-TFDM + MIRI + LY294002, H-TFDM + MIRI group, respectively, ##P < 0.01; *P < 0.05; **P < 0.01, n = 10).