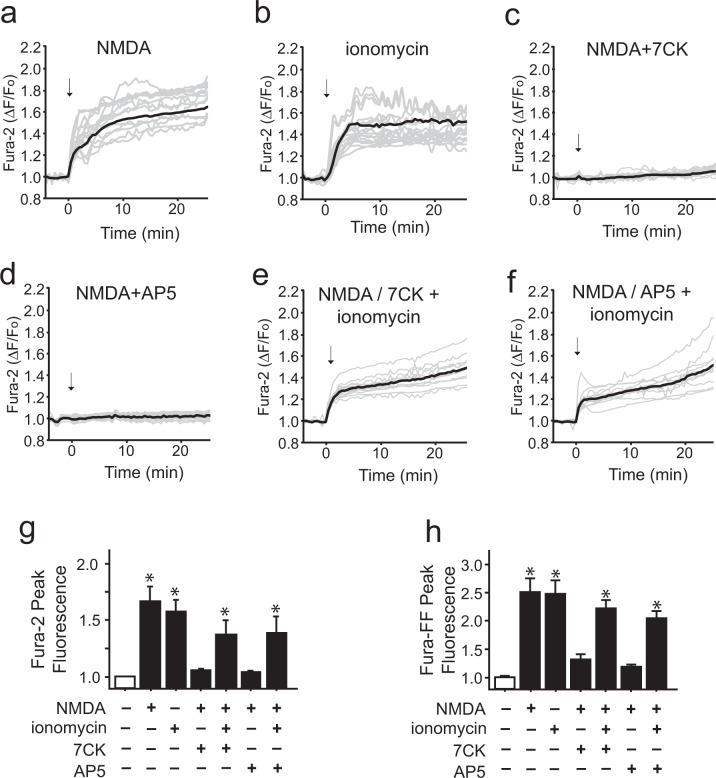
Figure 2.
Ionomycin can mimic the intracellular Ca2+ elevation induced by NMDA. (a–f) Traces show mean changes in intracellular Ca2+ (black line) measured in individual neurons (gray lines) loaded with the high-affinity Ca2+ indicator Fura-2. Arrows mark addition of 100 µM NMDA or 3 µM ionomycin. The Ca2+ rise induced by NMDA is blocked by either 100 µM 7CK or 30 µM AP5 (c,d), and in the presence of these inhibitors the additional presence of 3 µM ionomycin reconstitutes the Ca2+ increase (e,f). (g,h) Panels show aggregate intracellular peak Ca2+ elevations as measured by the high affinity dye Fura-2 and low affinity dye Fura-FF, respectively. Note the mean Ca2+ elevation induced by 3 µM ionomycin does not exceed that induced by NMDA. Values are expressed relative to the mean values of the control condition in each of n = 4 experiments. Data are means + s.e.m.; *p < 0.05 vs control.

