Fig. 3.
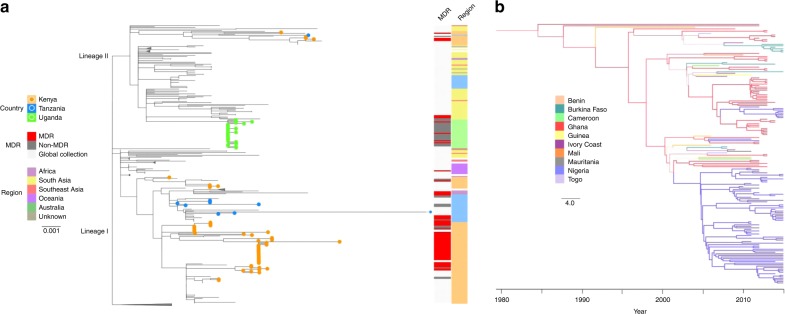
The phylogenetic structures of the major Salmonella Typhi genotypes in sub-Saharan Africa. a Maximum likelihood tree of genotype 4.3.1 S. Typhi isolates from this study in the context of other global genotype 4.3.1 S. Typhi isolates; the two distinct sub-lineages are labeled at the base of the tree. 4.3.1 S. Typhi isolates from this study (Kenya, Tanzania, and Uganda) are highlighted in corresponding coloured branches and circles at the tip of each tree. The first coloured bar shows the MDR phenotypes of study isolates. The second coloured bar outlines the continents and African regions where 4.3.1 S. Typhi have been detected. Scale bar indicates the number of substitutions per variable site; nodes of the tree have been collapsed for better visualization. b Maximum clade credibility tree (reconstructed using BEAST2) of genotype 3.1.1 S. Typhi isolates from this study in the context of other global genotype 3.1.1 S. Typhi isolates. Tree shows a phylogeographical reconstruction of genotype 3.1.1 S. Typhi isolates in West Africa. Branches are weighted by the support for the location changes; thicker branches have higher support. Branches and nodes are coloured according to the location that had the highest posterior probability values for some nodes of the tree. The scale bar indicates the number of substitutions per variable site per year

