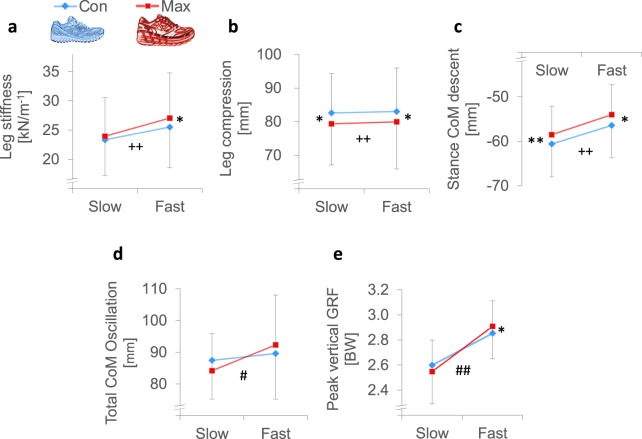
Figure 3.
Mean data (SD) of the (a) leg stiffness, (b) leg compression, (c) CoM decent during stance, (d) total CoM oscillation and (e) peak vertical GRF for the CON and MAX shoes at the slow (10 km/h) and fast (14.5 km/h) running speeds. Univariate difference between shoe conditions (t-test): *p < 0.05 and **p < 0.01. Shoe by speed interaction effects (a two-way repeated-measure ANOVA): #p < 0.05 and ##p < 0.01. The main effect for shoe conditions (a two-way repeated measures ANOVA): ++p < 0.01.

