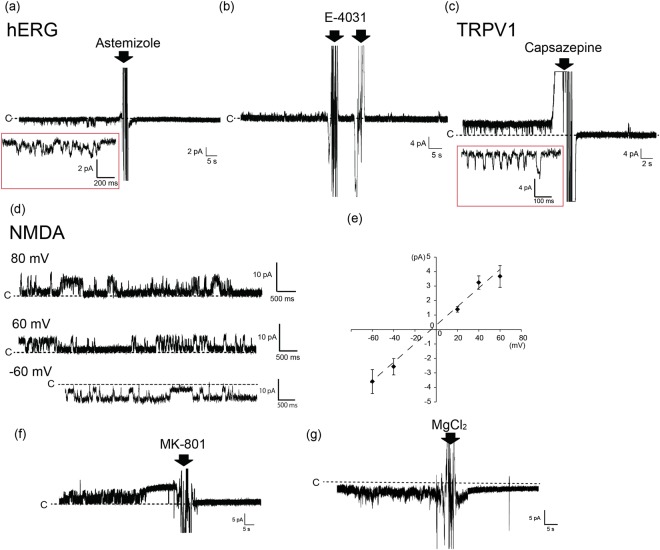
Figure 2.
(a,b) Current traces of the hERG channel with the addition of hERG inhibitors astemizole and E-4031. The final concentrations of astemizole and E-4031 were 100 nM and 200 μM, respectively. The red square represents an expansion of the hERG signal. The arrows represent the addition of inhibitors. Applied potential: −80 mV (a) and + 60 mV (b). (c) Current trace of TRPV1 channel with the addition of the TRPV1 inhibitor, capsazepine. The red square represents an expansion of the TRPV1 signal. The arrow represents the addition of capsazepine. The final concentration of capsazepine was 100 μM. Applied potential: + 60 mV. (d) Current trace of the NMDA channel. Applied potential: -60 mV, + 60 mV, and + 80 mV. (e) I-V curve of the NMDA channel. Error bars: s.d. (f) Inhibition of the NMDA channel signal by the NMDA inhibitor, MK-801. The arrow represents the addition of MK-801. The final concentration of MK-801 was 100 μM. Applied potential: +80 mV. (g) Inhibition of the NMDA channel signal by magnesium ion. The arrow represents the addition of MgCl2. The final concentration of MgCl2 was 5 mM. Applied potential: −80 mV.

