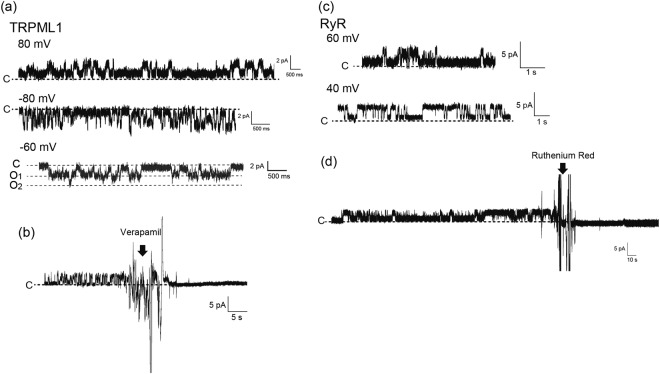
Figure 3.
(a) Current traces of the TRPML1 channel. Applied potential: +80 mV, −60 mV, and −80 mV. (b) Inhibition of TRPML1 channel signal by the TRPML1 inhibitor, verapamil. The arrow represents the addition of verapamil. The final concentration of verapamil was 1 mM. Applied potential: +80 mV. (c) Current trace of the RyR channel. Applied potential: +40 mV and +80 mV. (d) Inhibition of the RyR channel’s signal by the RyR inhibitor, ruthenium red. The arrow represents the addition of ruthenium red. The final concentration of ruthenium red was 500 nM. Applied potential: +40 mV.

