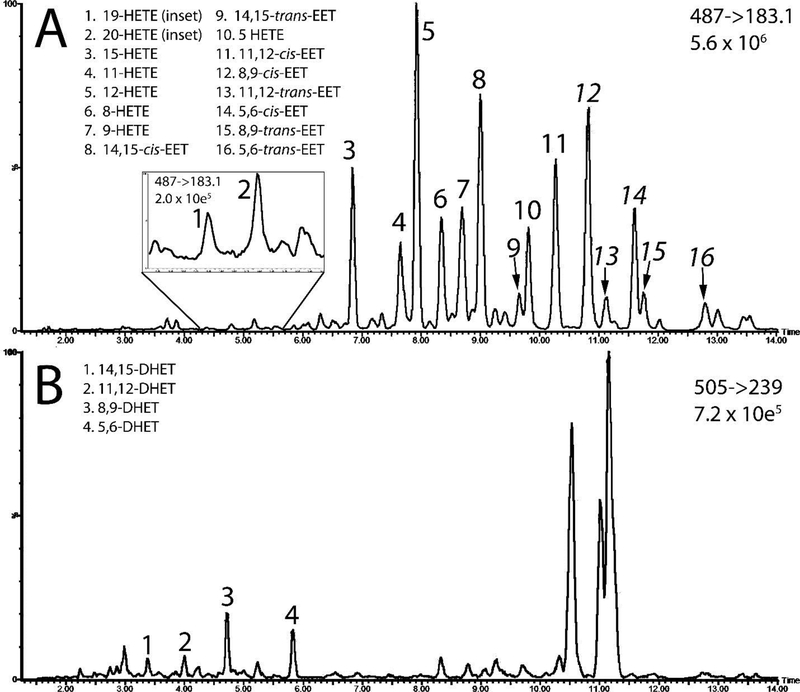
Figure 5.
Representative chromatograms of FAs after extraction from plasma. Daughter/fragment ions and the maximum instrument response are shown for each chromatogram. LC-MS channel containing the HETEs and EETs are shown in 5A, with an inset showing an expanded view of 19- and 20- HETE. The channel containing DHETs is shown in 5B.

