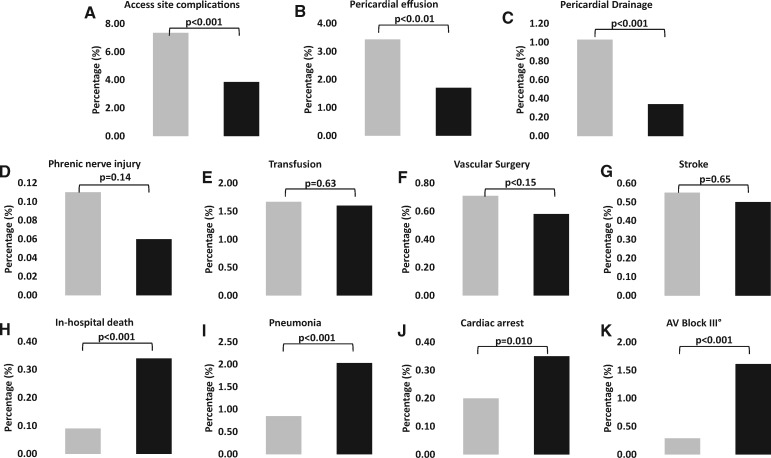
Figure 2.
Complication rates comparing any pulmonary vein isolation and/or left atrial ablation (Groups 1–4) vs. isolated right atrial ablation (Group 5). In each panel, cases with left atrial ablation procedures are displayed by grey bars and right atrial ablations are displayed by black bars. (A–C) Upper row shows complications with significantly higher rates in left vs. right atrial ablations. (D–G) Middle row shows complications with no significant differences between left vs. right atrial ablations. (H–K) Lower row shows complications with significantly higher rates in right vs. left atrial ablations. Groups are defined as in Table 1. Complication rates are expressed as percentage per group and compared by Fisher’s exact tests.

