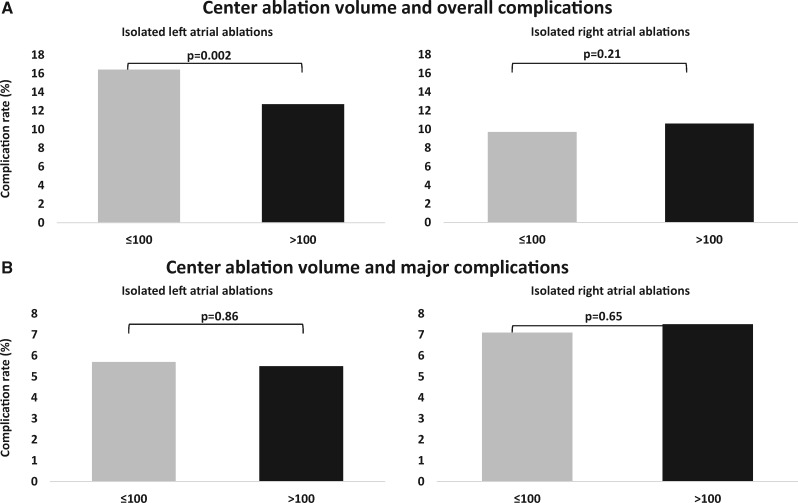
Figure 3.
Complication rates by centre ablation volume. Bars represent the cumulative incidences of complications occurring for isolated left atrial ablations and isolated right atrial ablation procedure, respectively, stratified by a centre ablation volume of ≤100 ablation procedures per year (grey bars) or >100 ablation procedures per year (black bars), respectively. The constituents of overall and major complications are provided in Tables 1 and 2. Table cell values individually blinded by the Research Data Center (RDC) for reasons of data protection (‘not assessed’) tend to underestimate the true occurrence of complications. For the aggregate presentation of data in the figure, we, therefore, inferred blinded cell values from all available data in Tables 1 and 2. Only for values not exactly inferable, we assumed a value of ‘1’ as the minimum possible count. Comparisons calculated by Fisher’s exact tests.

